Chart pattern: Bearish channel
-
- 0
- 8590
- 0
What is a bearish channel?
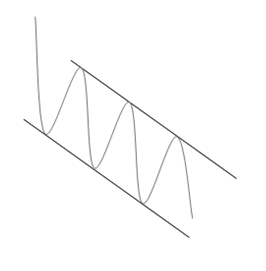
A bearish channel is a continuation chart pattern (of a trend). A bearish channel is formed by two parallel bearish lines. The price progresses between these two parallel lines; the upper line is called the "resistance line"; the lower line is called the "support line".
Each of these lines must have been touched at least twice to validate the pattern.
NB: a line is said to be "valid" if the price line touches the support or resistance at least 3 times.
This implies that the bearish channel pattern is considered valid if the price touches the support line at least 3 times and the resistance line twice (or the support line at least twice and the resistance line 3 times).
The bearish channel (with its inverse: the bullish channel) is the most frequent chart pattern and the one most used in technical analysis. It is found on all time units.
There is no theoretical price objective on this chart pattern. The movement is bearish and can continue as long as the bearish channel resistance line is not broken (channel exit).
Graphical representation of a bearish channel
Notes on bearish channels
- In a bearish channel, it is not advisable to open a long position (for purchase) in contact with the lower boundary (the channel’s support line). As the current trend is bearish, the only objective would be to aim for a return to the upper boundary (the channel’s resistance line), but generally with little prospect of performance. Focus on short positions (for sale) when the price falls back after hitting the bearish channel’s resistance line.
- If you want to avoid false breaks as much as possible (false channel exits), it is advisable to draw the trend lines (resistance and support lines) based on the candlesticks’ low and high points (wicks) and not the candlestick bodies.
- Statistics show us that bearish channel exits mostly occur on the fourth contact with the resistance line. However, the statistical output percentage on the fourth contact is low. It is therefore not advisable to aim for a bearish channel exit when the price is about to test the resistance line for the fourth time.
- It should be noted that the more often the resistance line has been tested and has held during the fall, the more severe the break out of the resistance line / bearish channel exit is.
- When the price has validated a bearish channel exit, it is very common for the price to make a pullback in support on the bearish channel’s resistance line; even the price continues its progress above the channel’s resistance line (generally forming in the end a wider bearish channel; creation of a new resistance line).
For your information: A bearish channel is a continuation chart pattern. Its opposite is a bullish channel.


