The basics of technical analysis
-
- 0
- 1075
- 0
Technical analysis is the most common method of analysis that individuals use in trading. To perform good technical analysis, it is important to respect certain basic rules even before plotting technical elements (chart patterns, resistances, supports, etc.) or to add indicators. These basic elements are often forgotten by individuals starting out in technical analysis.
Japanese candlesticks come from Japan and have been adopted by all technical analysts. It is the graphical representation that gives the most information about prices. With Japanese candlesticks in trading it is possible to identify investors’ psychology.
Japanese candlesticks give the following information about the chosen period:
- Opening price
- Closing price
- Highest point
- Lowest point
Japanese candlesticks give the same information as a bar chart display, the difference is that the candlestick is given a colour depending on whether it is bearish or bullish. Technical analysis is then easier, allowing your eyes to analyse the price chart more quickly. With a little practice, you will see that without performing any technical analysis, you can identify the idea of a trade at a glance.
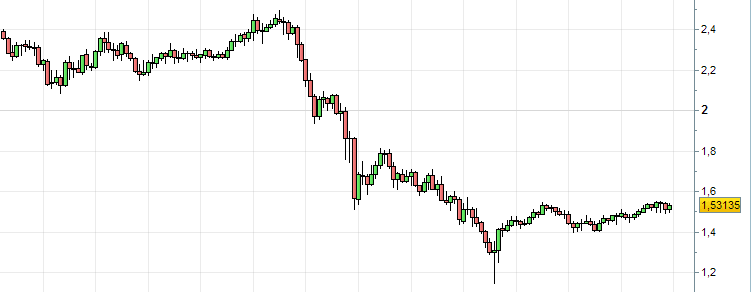
There are multiple configurations of Japanese candlesticks in technical analysis. I advise you to learn at least the reversal dojis which are one of the bases of technical analysis. Here is an example of a graphical representation with Japanese candlesticks:
This is a mistake that can be seen among a lot of novice traders. They are trying to do technical analysis on a chart zoomed on the last candlesticks. Having a clear vision of the last candlesticks is good (as I said earlier, you can find valuable information there) but you also need to have a global vision. The goal is to be able to correctly identify an asset’s trend on the unit of time you are analysing.
Unzooming your price chart is essential to be able to identify the right levels of resistance/support lines, to identify the different chart patterns and to display the Fibonacci retracements.
This enables you to understand the price movements better and especially not to be mistaken about the bullish/bearish signals that are important to take into account.
Let’s consider an example:
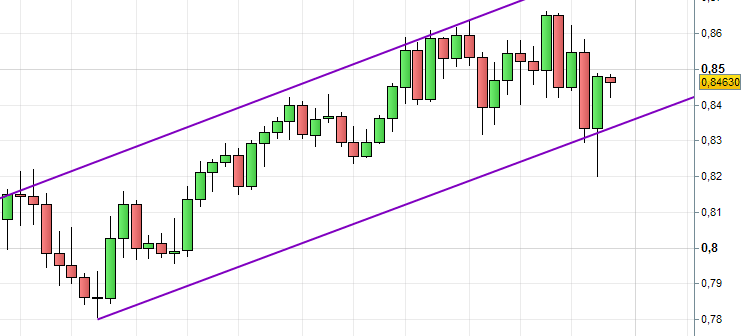
Wow, great, a bullish channel, it just bounced off the lower limit as well, you think it's a great opportunity to get in long.
Let's take the same chart, this time unzoomed:
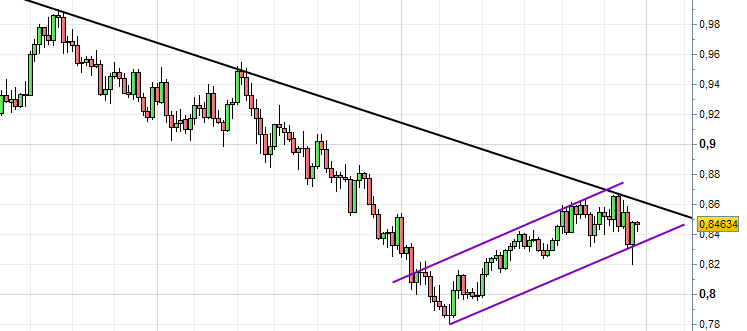
In fact, there is a bearish trend line and the bullish channel is actually a flag consolidation pattern. The probability of a reversal of the bearish movement is therefore higher. So, don’t go long, but wait for the channel exit to go short. Only a break in the bearish downward slant will enable you to go long but not before. The odds are against you! Technical analysis is not an exact science but it is based on mathematics.
Before you start doing technical analysis, you must determine the time unit of your trade. Two elements need to be taken into account in choosing a time unit:
- Investment horizon: Is it a short, medium or long term investment?
If it is short term, use time units between 5 minutes and 1 hour. Most trades are closed within the trading day.
If you prefer the middle term, choose time units between 4 hours and a day. Trades can range from a few days to several weeks.
If you are going for the long term, use weekly or monthly time units. Trades are kept for several months.
- Your price objectives: Are they far from the entry price?
The further away the price objective is from the entry price in terms of points, the longer your time unit should be.
There is no point in analysing a 15 minute chart if your price target is several hundred points (on Forex) or represents a significant percentage change from the entry price (on the stock market). Worse, it will give you false bullish/bearish signals that are not related to the trend of the time unit related to your price objective.
The choice of the trade’s time unit is very important. It also depends on your trading psychology. Some people prefer short term trading, others long term (less stress and trading time).
Once you have performed technical analysis on your trade’s time unit, it is better to analyse the longer time unit to determine the trend. It is important to distinguish between the signal chart (your trade’s chart) and the trend chart (the longer time unit’s chart).
Indeed, the trend can be bullish in the short term and bearish in the medium term. The longest trend always takes over. If the longer time unit’s trend is in the opposite direction to your trade, you should not open a position. This is the principle of one-way trading. Trading against the trend is not prohibited, but it is better to firstlyidentify reversal signals on your trend chart.
This is why thorough technical analysis of the trend chart is important. It enables you to determine levels from which you can either trade long or short positions or remain neutral on shorter time units.
Using a graphical representation with Japanese candlesticks
Japanese candlesticks come from Japan and have been adopted by all technical analysts. It is the graphical representation that gives the most information about prices. With Japanese candlesticks in trading it is possible to identify investors’ psychology.
Japanese candlesticks give the following information about the chosen period:
- Opening price
- Closing price
- Highest point
- Lowest point
Japanese candlesticks give the same information as a bar chart display, the difference is that the candlestick is given a colour depending on whether it is bearish or bullish. Technical analysis is then easier, allowing your eyes to analyse the price chart more quickly. With a little practice, you will see that without performing any technical analysis, you can identify the idea of a trade at a glance.
There are multiple configurations of Japanese candlesticks in technical analysis. I advise you to learn at least the reversal dojis which are one of the bases of technical analysis. Here is an example of a graphical representation with Japanese candlesticks:
Unzoom your chart to get a global view
This is a mistake that can be seen among a lot of novice traders. They are trying to do technical analysis on a chart zoomed on the last candlesticks. Having a clear vision of the last candlesticks is good (as I said earlier, you can find valuable information there) but you also need to have a global vision. The goal is to be able to correctly identify an asset’s trend on the unit of time you are analysing.
Unzooming your price chart is essential to be able to identify the right levels of resistance/support lines, to identify the different chart patterns and to display the Fibonacci retracements.
This enables you to understand the price movements better and especially not to be mistaken about the bullish/bearish signals that are important to take into account.
Let’s consider an example:
Wow, great, a bullish channel, it just bounced off the lower limit as well, you think it's a great opportunity to get in long.
Let's take the same chart, this time unzoomed:
In fact, there is a bearish trend line and the bullish channel is actually a flag consolidation pattern. The probability of a reversal of the bearish movement is therefore higher. So, don’t go long, but wait for the channel exit to go short. Only a break in the bearish downward slant will enable you to go long but not before. The odds are against you! Technical analysis is not an exact science but it is based on mathematics.
Use a chart in line with your objectives
Before you start doing technical analysis, you must determine the time unit of your trade. Two elements need to be taken into account in choosing a time unit:
- Investment horizon: Is it a short, medium or long term investment?
If it is short term, use time units between 5 minutes and 1 hour. Most trades are closed within the trading day.
If you prefer the middle term, choose time units between 4 hours and a day. Trades can range from a few days to several weeks.
If you are going for the long term, use weekly or monthly time units. Trades are kept for several months.
- Your price objectives: Are they far from the entry price?
The further away the price objective is from the entry price in terms of points, the longer your time unit should be.
There is no point in analysing a 15 minute chart if your price target is several hundred points (on Forex) or represents a significant percentage change from the entry price (on the stock market). Worse, it will give you false bullish/bearish signals that are not related to the trend of the time unit related to your price objective.
The choice of the trade’s time unit is very important. It also depends on your trading psychology. Some people prefer short term trading, others long term (less stress and trading time).
Analyse the chart on a longer time unit
Once you have performed technical analysis on your trade’s time unit, it is better to analyse the longer time unit to determine the trend. It is important to distinguish between the signal chart (your trade’s chart) and the trend chart (the longer time unit’s chart).
Indeed, the trend can be bullish in the short term and bearish in the medium term. The longest trend always takes over. If the longer time unit’s trend is in the opposite direction to your trade, you should not open a position. This is the principle of one-way trading. Trading against the trend is not prohibited, but it is better to firstlyidentify reversal signals on your trend chart.
This is why thorough technical analysis of the trend chart is important. It enables you to determine levels from which you can either trade long or short positions or remain neutral on shorter time units.


