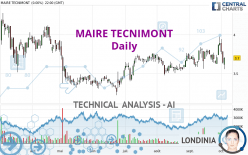
MAIRE - Daily - Technical analysis published on 10/05/2023 (GMT)
- 124
- 0
Click here for a new analysis!
- Timeframe : Daily
- - Analysis generated on
- Status : TARGET REACHED

Summary of the analysis

Additional analysis
Quotes
MAIRE TECNIMONT rating 3.886 EUR. The price registered an increase of +5.03% on the session with the lowest point at 3.842 EUR and the highest point at 4.120 EUR. The deviation from the price is +1.15% for the low point and -5.68% for the high point.A bullish gap was detected at the opening by the Central Gaps scanner. There are a lot of buyers and they have the upper hand in the very short term.
Opening Gap UP
Type : Bullish
Timeframe : Openning
So that you have an overall view of the price change, here is a table showing the variations over several periods:
Near a new HIGH record (1 year)
Type : Bullish
Timeframe : Weekly
Near a new HIGH record (1st january)
Type : Bullish
Timeframe : Weekly
New HIGH record (1 month)
Type : Bullish
Timeframe : Weekly
The Central Volumes scanner notes the presence of abnormal volumes:
Abnormal volumes
Timeframe : 5 days
Technical
Technical analysis of MAIRE TECNIMONT in Daily shows a strongly overall bullish trend. The signals given by the moving averages are 92.86% bullish. This strong bullish trend is confirmed by the strong signals currently being given by short-term moving averages. The Central Indicators scanner detects a bullish signal on moving averages that could impact this trend:
Bullish price crossover with Moving Average 20
Type : Bullish
Timeframe : Daily
In fact, of the 18 technical indicators analysed by Central Analyzer, 11 are bullish, 3 are neutral and 4 are bearish. But beware of excesses. The Central Indicators scanner currently detects this:
CCI indicator is overbought : over 100
Type : Neutral
Timeframe : Daily
Pivot points : price is over resistance 2
Type : Neutral
Timeframe : Daily
RSI indicator is back over 50
Type : Bullish
Timeframe : Daily
MACD crosses UP its Moving Average
Type : Bullish
Timeframe : Daily
Parabolic SAR indicator bullish reversal
Type : Bullish
Timeframe : Daily
Aroon indicator bullish trend
Type : Bullish
Timeframe : Daily
Momentum indicator is back over 0
Type : Bullish
Timeframe : Daily
Williams %R indicator is back over -50
Type : Bullish
Timeframe : Daily
An analysis of the price chart with the Central Patterns scanner (detector of chart patterns and resistances and supports) shows several results that can have an impact on the price change:
Near resistance of channel
Type : Bearish
Timeframe : Daily
Horizontal resistance is broken
Type : Bullish
Timeframe : Daily
The Central Candlesticks scanner, specialised in Japanese candlesticks, did not identify any signals.
| S3 | S2 | S1 | Price | R1 | R2 | R3 | |
|---|---|---|---|---|---|---|---|
| ProTrendLines | 3.510 | 3.640 | 3.753 | 3.886 | 3.969 | 4.331 | 6.411 |
| Change (%) | -9.68% | -6.33% | -3.42% | - | +2.14% | +11.45% | +64.98% |
| Change | -0.376 | -0.246 | -0.133 | - | +0.083 | +0.445 | +2.525 |
| Level | Intermediate | Major | Major | - | Intermediate | Major | Minor |
Pivot points can also be used to set your price objectives. Here is the price situation in relation to pivot points:
| Pivot points | S3 | S2 | S1 | PP | R1 | R2 | R3 |
|---|---|---|---|---|---|---|---|
| Standard | 3.444 | 3.500 | 3.600 | 3.656 | 3.756 | 3.812 | 3.912 |
| Camarilla | 3.657 | 3.671 | 3.686 | 3.700 | 3.714 | 3.729 | 3.743 |
| Woodie | 3.466 | 3.511 | 3.622 | 3.667 | 3.778 | 3.823 | 3.934 |
| Fibonacci | 3.500 | 3.560 | 3.596 | 3.656 | 3.716 | 3.752 | 3.812 |
| Pivot points | S3 | S2 | S1 | PP | R1 | R2 | R3 |
|---|---|---|---|---|---|---|---|
| Standard | 3.331 | 3.477 | 3.685 | 3.831 | 4.039 | 4.185 | 4.393 |
| Camarilla | 3.795 | 3.827 | 3.860 | 3.892 | 3.925 | 3.957 | 3.989 |
| Woodie | 3.361 | 3.493 | 3.715 | 3.847 | 4.069 | 4.201 | 4.423 |
| Fibonacci | 3.477 | 3.613 | 3.696 | 3.831 | 3.967 | 4.050 | 4.185 |
| Pivot points | S3 | S2 | S1 | PP | R1 | R2 | R3 |
|---|---|---|---|---|---|---|---|
| Standard | 3.227 | 3.395 | 3.643 | 3.811 | 4.059 | 4.227 | 4.475 |
| Camarilla | 3.778 | 3.816 | 3.854 | 3.892 | 3.930 | 3.968 | 4.006 |
| Woodie | 3.268 | 3.415 | 3.684 | 3.831 | 4.100 | 4.247 | 4.516 |
| Fibonacci | 3.395 | 3.554 | 3.652 | 3.811 | 3.970 | 4.068 | 4.227 |
Numerical data
The following is the status of technical indicators and moving averages registered at the time this technical analysis was created:
| RSI (14): | 57.98 | |
| MACD (12,26,9): | 0.0290 | |
| Directional Movement: | 16.724 | |
| AROON (14): | 7.143 | |
| DEMA (21): | 3.782 | |
| Parabolic SAR (0,02-0,02-0,2): | 3.556 | |
| Elder Ray (13): | 0.223 | |
| Super Trend (3,10): | 3.609 | |
| Zig ZAG (10): | 3.884 | |
| VORTEX (21): | 0.9960 | |
| Stochastique (14,3,5): | 37.01 | |
| TEMA (21): | 3.787 | |
| Williams %R (14): | -41.84 | |
| Chande Momentum Oscillator (20): | 0.094 | |
| Repulse (5,40,3): | -7.6040 | |
| ROCnROLL: | 1 | |
| TRIX (15,9): | 0.1140 | |
| Courbe Coppock: | 1.18 |
| MA7: | 3.783 | |
| MA20: | 3.755 | |
| MA50: | 3.680 | |
| MA100: | 3.584 | |
| MAexp7: | 3.774 | |
| MAexp20: | 3.743 | |
| MAexp50: | 3.691 | |
| MAexp100: | 3.629 | |
| Price / MA7: | +2.72% | |
| Price / MA20: | +3.49% | |
| Price / MA50: | +5.60% | |
| Price / MA100: | +8.43% | |
| Price / MAexp7: | +2.97% | |
| Price / MAexp20: | +3.82% | |
| Price / MAexp50: | +5.28% | |
| Price / MAexp100: | +7.08% |
News
The latest news and videos published on MAIRE TECNIMONT at the time of the analysis were as follows:
- NEXTCHEM (MAIRE TECNIMONT GROUP) AWARDED PRE - FEED ENGINEERING SERVICES CONTRACT FOR THE INTEGRATED RENEWABLE HYDROGEN AND GREEN AMMONIA BY MADOQUAPOWER2X IN SINES, PORTUGAL
- NEXTCHEM AWARDED ADVANCED BASIC ENGINEERING STUDY BY STORENGY (ENGIE) FOR A NEW WAY OF PRODUCING BIOMETHANE FROM PYROGASIFICATION OF WASTE WOOD
- Maire Tecnimont Group (MT.MI) Reaches an Agreement With Greenfield Nitrogen LLC for the Development of a Green Ammonia Plant in the United States
- Maire Tecnimont Group (MT.MI) Reaches an Agreement With Greenfield Nitrogen LLC for the Development of a Green Ammonia Plant in the United States
- Maire Tecnimont Group (MT.MI) Reaches an Agreement With Greenfield Nitrogen LLC for the Development of a Green Ammonia Plant in the United States
About author
Online


Add a comment
Comments
0 comments on the analysis MAIRE - Daily