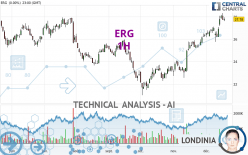
ERG - 1H - Technical analysis published on 12/20/2023 (GMT)
- 84
- 0
Click here for a new analysis!
- Timeframe : 1H
- - Analysis generated on
- Status : TARGET REACHED

Summary of the analysis

Additional analysis
Quotes
The ERG rating is 28.00 EUR. On the day, this instrument gained +0.79% with the lowest point at 27.62 EUR and the highest point at 28.00 EUR. The deviation from the price is +1.38% for the low point and 0% for the high point.Here is a more detailed summary of the historical variations registered by ERG:
Near a new HIGH record (1 year)
Type : Bullish
Timeframe : Weekly
Near a new HIGH record (1st january)
Type : Bullish
Timeframe : Weekly
Near a new HIGH record (1 month)
Type : Bullish
Timeframe : Weekly
Technical
Technical analysis of this 1H chart of ERG indicates that the overall trend is strongly bullish. 89.29% of the signals given by moving averages are bullish. The slightly bullish signals given by the short-term moving averages show a weakening of the global trend. The Central Indicators scanner detects a bullish signal on moving averages that could impact this trend:
Bullish price crossover with adaptative moving average 20
Type : Bullish
Timeframe : 1 hour
In fact, according to the parameters integrated into the Central Analyzer system, 14 technical indicators out of 18 analysed are currently bullish. Caution: the Central Indicators scanner currently detects an excess:
Williams %R indicator is overbought : over -20
Type : Neutral
Timeframe : 1 hour
Pivot points : price is over resistance 1
Type : Neutral
Timeframe : 1 hour
MACD crosses UP its Moving Average
Type : Bullish
Timeframe : 1 hour
Aroon indicator bullish trend
Type : Bullish
Timeframe : 1 hour
An analysis of the price chart with the Central Patterns scanner (detector of chart patterns and resistances and supports) shows a result that can have an impact on the price change:
Near horizontal support
Type : Bullish
Timeframe : 1 hour
Central Candlesticks, the scanner specialised in Japanese candlesticks, detects these signals that could have an impact on the current short-term trend:
Upside gap
Type : Bullish
Timeframe : 1 hour
Doji
Type : Neutral
Timeframe : 1 hour
| S3 | S2 | S1 | Price | R1 | R2 | R3 | |
|---|---|---|---|---|---|---|---|
| ProTrendLines | 26.18 | 27.10 | 27.80 | 28.00 | 28.32 | 30.29 | 34.32 |
| Change (%) | -6.50% | -3.21% | -0.71% | - | +1.14% | +8.18% | +22.57% |
| Change | -1.82 | -0.90 | -0.20 | - | +0.32 | +2.29 | +6.32 |
| Level | Intermediate | Minor | Major | - | Intermediate | Intermediate | Major |
To determine price objectives, it is also possible to use the pivot points. Here is the price position in relation to pivot points:
| Pivot points | S3 | S2 | S1 | PP | R1 | R2 | R3 |
|---|---|---|---|---|---|---|---|
| Standard | 27.29 | 27.45 | 27.61 | 27.77 | 27.93 | 28.09 | 28.25 |
| Camarilla | 27.69 | 27.72 | 27.75 | 27.78 | 27.81 | 27.84 | 27.87 |
| Woodie | 27.30 | 27.45 | 27.62 | 27.77 | 27.94 | 28.09 | 28.26 |
| Fibonacci | 27.45 | 27.57 | 27.64 | 27.77 | 27.89 | 27.96 | 28.09 |
| Pivot points | S3 | S2 | S1 | PP | R1 | R2 | R3 |
|---|---|---|---|---|---|---|---|
| Standard | 24.11 | 24.93 | 26.51 | 27.33 | 28.91 | 29.73 | 31.31 |
| Camarilla | 27.42 | 27.64 | 27.86 | 28.08 | 28.30 | 28.52 | 28.74 |
| Woodie | 24.48 | 25.12 | 26.88 | 27.52 | 29.28 | 29.92 | 31.68 |
| Fibonacci | 24.93 | 25.85 | 26.42 | 27.33 | 28.25 | 28.82 | 29.73 |
| Pivot points | S3 | S2 | S1 | PP | R1 | R2 | R3 |
|---|---|---|---|---|---|---|---|
| Standard | 19.81 | 21.19 | 23.75 | 25.13 | 27.69 | 29.07 | 31.63 |
| Camarilla | 25.24 | 25.60 | 25.96 | 26.32 | 26.68 | 27.04 | 27.40 |
| Woodie | 20.41 | 21.49 | 24.35 | 25.43 | 28.29 | 29.37 | 32.23 |
| Fibonacci | 21.19 | 22.69 | 23.62 | 25.13 | 26.63 | 27.56 | 29.07 |
Numerical data
The following are the details of the technical indicators and moving averages that were collected to generate this technical analysis:
| RSI (14): | 56.65 | |
| MACD (12,26,9): | 0.0300 | |
| Directional Movement: | 13.52 | |
| AROON (14): | 64.29 | |
| DEMA (21): | 27.85 | |
| Parabolic SAR (0,02-0,02-0,2): | 27.63 | |
| Elder Ray (13): | 0.13 | |
| Super Trend (3,10): | 27.59 | |
| Zig ZAG (10): | 27.94 | |
| VORTEX (21): | 0.9900 | |
| Stochastique (14,3,5): | 87.73 | |
| TEMA (21): | 27.77 | |
| Williams %R (14): | -5.56 | |
| Chande Momentum Oscillator (20): | 0.10 | |
| Repulse (5,40,3): | 0.4800 | |
| ROCnROLL: | 1 | |
| TRIX (15,9): | 0.0100 | |
| Courbe Coppock: | 0.36 |
| MA7: | 27.49 | |
| MA20: | 26.73 | |
| MA50: | 24.91 | |
| MA100: | 24.53 | |
| MAexp7: | 27.84 | |
| MAexp20: | 27.80 | |
| MAexp50: | 27.62 | |
| MAexp100: | 27.25 | |
| Price / MA7: | +1.86% | |
| Price / MA20: | +4.75% | |
| Price / MA50: | +12.40% | |
| Price / MA100: | +14.15% | |
| Price / MAexp7: | +0.57% | |
| Price / MAexp20: | +0.72% | |
| Price / MAexp50: | +1.38% | |
| Price / MAexp100: | +2.75% |
News
The last news published on ERG at the time of the generation of this analysis was as follows:
About author
Online


Add a comment
Comments
0 comments on the analysis ERG - 1H