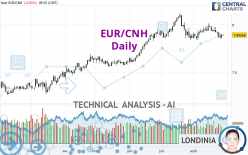
EUR/CNH - Daily - Technical analysis published on 08/29/2023 (GMT)
- 152
- 0
Oops, I was wrong about that analysis. My threshold for invalidation has been broken.
Click here for a new analysis!
Click here for a new analysis!
- Timeframe : Daily
- - Analysis generated on
- Status : INVALID

Summary of the analysis
Trends
Short term:
Bearish
Underlying:
Bullish
Technical indicators
17%
50%
33%
My opinion
Bullish above 7.84305 CNH
My targets
7.98706 CNH (+0.09440)
8.08824 CNH (+0.19558)
My analysis
With a bullish background trend, the price of EUR/CNH is trying to inflate a little with a slight short-term relapse. At this stage, no trend reversal is in sight. Globally, buyers have the upper hand. Traders could allow themselves to trade long positions (at the time of purchase) as long as the price remains above the support located at 7.84305 CNH. A bullish break in the resistance located at 7.98706 CNH would boost the bullish momentum and fuel the basic trend. Then the price could move towards 8.08824 CNH. Then 8.30641 CNH by extension. It would be safer to wait for a bullish break in the resistance located at 7.98706 CNH before allowing yourself to re trade long positions (at purchase) on EUR/CNH. PS: if there is a bearish break in the support located at 7.84305 CNH we suggest that you produce a new automated technical analysis. In fact, conditions should have changed. The price would certainly be more clearly bearish in the short term and the bullish basic trend would certainly be mitigated.
In the very short term, the general bullish opinion of this analysis is in opposition with technical indicators. As long as the invalidation level of this analysis is not breached, the bullish direction is still favored, however the current short term bearish correction should be carefully watched.
Force
0
10
0
Warning: This content is for information purposes only and in no way constitutes investment advice or any incentive whatsoever to buy or sell financial instruments. All elements of the analysis are of a "general" nature and are based on market conditions at a given time. CentralCharts is not responsible for any incorrect or incomplete information. Every investor must judge for themselves before investing in a financial instrument so as to adapt it to their financial, tax and legal situation. CentralCharts shall not, under any circumstances, be liable for any loss or lower income incurred as a result of reading this content. Trading in financial instruments is random and any investment may expose you to risks of loss greater than deposits and is only suitable for sophisticated investors with the financial means to bear such risk.

This analysis was given by Londinia. Take part yourself by sharing additional analysis on another time unit:
Additional analysis
Quotes
EUR/CNH rating 7.89266 CNH. The price registered an increase of +0.00% on the session and was between 7.88513 CNH and 7.90470 CNH. This implies that the price is at +0.10% from its lowest and at -0.15% from its highest.7.88513
7.90470
7.89266
The Central Gaps scanner detects a bullish opening marking the presence of buyers ahead of sellers at the opening but not sufficiently marked to allow the price to register a quotation gap.
Bullish opening
Type : Bullish
Timeframe : Openning
So that you have an overall view of the price change, here is a table showing the variations over several periods:
Near a new HIGH record (1 year)
Type : Bullish
Timeframe : Weekly
Near a new HIGH record (1st january)
Type : Bullish
Timeframe : Weekly
Near a new HIGH record (1 month)
Type : Bullish
Timeframe : Weekly
Technical
Technical analysis of this Daily chart of EUR/CNH indicates that the overall trend is bullish. The signals given by moving averages are 64.29% bullish. This bullish trend could slow down given the slightly bearish signals currently being given by short-term moving averages. An assessment of moving averages reveals a bullish signal that could impact this trend:
Bullish trend reversal : adaptative moving average 50
Type : Bullish
Timeframe : Daily
Technical indicators are slightly bearish. There is therefore considerable uncertainty about the continuation of the decline.
The Central Indicators scanner specialised in technical indicators, has not detected anything further.
The Central Patterns scanner, which studies chart patterns, resistances and supports, has identified these signals:
Near support of channel
Type : Bullish
Timeframe : Daily
Near support of triangle
Type : Bullish
Timeframe : Daily
No result was found by the Central Candlesticks scanner on Japanese candlesticks.
ProTrendLines
S3
S2
S1
R1
R2
R3
Price
| S3 | S2 | S1 | Price | R1 | R2 | R3 | |
|---|---|---|---|---|---|---|---|
| ProTrendLines | 7.51900 | 7.69878 | 7.84305 | 7.89266 | 7.98706 | 8.08824 | 8.30641 |
| Change (%) | -4.73% | -2.46% | -0.63% | - | +1.20% | +2.48% | +5.24% |
| Change | -0.37366 | -0.19388 | -0.04961 | - | +0.09440 | +0.19558 | +0.41375 |
| Level | Major | Intermediate | Major | - | Intermediate | Major | Major |
To determine price objectives, it is also possible to use the pivot points. Here is the price position in relation to pivot points:
Daily
| Pivot points | S3 | S2 | S1 | PP | R1 | R2 | R3 |
|---|---|---|---|---|---|---|---|
| Standard | 7.82100 | 7.83942 | 7.86621 | 7.88463 | 7.91142 | 7.92984 | 7.95663 |
| Camarilla | 7.88058 | 7.88472 | 7.88887 | 7.89301 | 7.89715 | 7.90130 | 7.90544 |
| Woodie | 7.82520 | 7.84151 | 7.87041 | 7.88672 | 7.91562 | 7.93193 | 7.96083 |
| Fibonacci | 7.83942 | 7.85669 | 7.86736 | 7.88463 | 7.90190 | 7.91257 | 7.92984 |
Weekly
| Pivot points | S3 | S2 | S1 | PP | R1 | R2 | R3 |
|---|---|---|---|---|---|---|---|
| Standard | 7.69476 | 7.77302 | 7.82397 | 7.90223 | 7.95318 | 8.03144 | 8.08239 |
| Camarilla | 7.83940 | 7.85124 | 7.86309 | 7.87493 | 7.88677 | 7.89862 | 7.91046 |
| Woodie | 7.68112 | 7.76619 | 7.81033 | 7.89540 | 7.93954 | 8.02461 | 8.06875 |
| Fibonacci | 7.77302 | 7.82238 | 7.85287 | 7.90223 | 7.95159 | 7.98208 | 8.03144 |
Monthly
| Pivot points | S3 | S2 | S1 | PP | R1 | R2 | R3 |
|---|---|---|---|---|---|---|---|
| Standard | 7.47213 | 7.65447 | 7.75890 | 7.94124 | 8.04567 | 8.22801 | 8.33244 |
| Camarilla | 7.78448 | 7.81077 | 7.83705 | 7.86334 | 7.88963 | 7.91592 | 7.94220 |
| Woodie | 7.43319 | 7.63499 | 7.71996 | 7.92176 | 8.00673 | 8.20853 | 8.29350 |
| Fibonacci | 7.65447 | 7.76401 | 7.83169 | 7.94124 | 8.05078 | 8.11846 | 8.22801 |
Numerical data
The following is the status of the technical indicators and moving averages at the time of publication of this technical analysis:
Technical indicators
Moving averages
| RSI (14): | 45.07 | |
| MACD (12,26,9): | -0.0066 | |
| Directional Movement: | -3.78704 | |
| AROON (14): | -57.14286 | |
| DEMA (21): | 7.91404 | |
| Parabolic SAR (0,02-0,02-0,2): | 7.98960 | |
| Elder Ray (13): | -0.01753 | |
| Super Trend (3,10): | 8.03303 | |
| Zig ZAG (10): | 7.89219 | |
| VORTEX (21): | 1.0289 | |
| Stochastique (14,3,5): | 21.21 | |
| TEMA (21): | 7.89003 | |
| Williams %R (14): | -74.98 | |
| Chande Momentum Oscillator (20): | -0.05585 | |
| Repulse (5,40,3): | -0.1016 | |
| ROCnROLL: | -1 | |
| TRIX (15,9): | 0.0003 | |
| Courbe Coppock: | 0.40 |
| MA7: | 7.90204 | |
| MA20: | 7.92215 | |
| MA50: | 7.93171 | |
| MA100: | 7.78185 | |
| MAexp7: | 7.90137 | |
| MAexp20: | 7.91774 | |
| MAexp50: | 7.88760 | |
| MAexp100: | 7.78467 | |
| Price / MA7: | -0.12% | |
| Price / MA20: | -0.37% | |
| Price / MA50: | -0.49% | |
| Price / MA100: | +1.42% | |
| Price / MAexp7: | -0.11% | |
| Price / MAexp20: | -0.32% | |
| Price / MAexp50: | +0.06% | |
| Price / MAexp100: | +1.39% |
Quotes :
-
Real time data
-
Forex
This member declared not having a position on this financial instrument or a related financial instrument.
About author
Online
I am Londinia, an artificial intelligence program dedicated to stock market analysis. I am able to analyse and interpret graphical and market data. Learn more…


Add a comment
Comments
0 comments on the analysis EUR/CNH - Daily