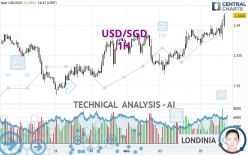
USD/SGD - 1H - Technical analysis published on 12/05/2023 (GMT)
- 122
- 0
Click here for a new analysis!
- Timeframe : 1H
- - Analysis generated on
- Status : LEVEL MAINTAINED

Summary of the analysis

Additional analysis
Quotes
The USD/SGD rating is 1.3416 SGD. The price has increased by +0.29% since the last closing and was between 1.3367 SGD and 1.3420 SGD. This implies that the price is at +0.37% from its lowest and at -0.03% from its highest.So that you have an overall view of the price change, here is a table showing the variations over several periods:
Near a new LOW record (5 years)
Type : Bearish
Timeframe : Weekly
Near a new HIGH record (1 year)
Type : Bullish
Timeframe : Weekly
Near a new HIGH record (1st january)
Type : Bullish
Timeframe : Weekly
Near a new HIGH record (1 month)
Type : Bullish
Timeframe : Weekly
Technical
Technical analysis of USD/SGD in 1H shows a strongly overall bullish trend. The signals given by the moving averages are 92.86% bullish. This strong bullish trend is confirmed by the strong signals currently being given by short-term moving averages. The Central Indicators scanner detects a bullish signal on moving averages that could impact this trend:
Moving Average bullish crossovers : AMA50 & AMA100
Type : Bullish
Timeframe : 1 hour
In fact, 15 technical indicators on 18 studied are currently positioned bullish. But beware of excesses. The Central Indicators scanner currently detects this:
RSI indicator is overbought : over 70
Type : Neutral
Timeframe : 1 hour
CCI indicator is overbought : over 100
Type : Neutral
Timeframe : 1 hour
Williams %R indicator is overbought : over -20
Type : Neutral
Timeframe : 1 hour
Pivot points : price is over resistance 1
Type : Neutral
Timeframe : 1 hour
Pivot points : price is over resistance 1
Type : Neutral
Timeframe : Weekly
An analysis of the price chart with the Central Patterns scanner (detector of chart patterns and resistances and supports) shows a result that can have an impact on the price change:
Near resistance of triangle
Type : Bearish
Timeframe : 1 hour
The Central Candlesticks scanner, specialised in Japanese candlesticks, did not identify any signals.
| S3 | S2 | S1 | Price | R1 | R2 | R3 | |
|---|---|---|---|---|---|---|---|
| ProTrendLines | 1.3367 | 1.3378 | 1.3409 | 1.3416 | 1.3424 | 1.3464 | 1.3548 |
| Change (%) | -0.37% | -0.28% | -0.05% | - | +0.06% | +0.36% | +0.98% |
| Change | -0.0049 | -0.0038 | -0.0007 | - | +0.0008 | +0.0048 | +0.0132 |
| Level | Minor | Intermediate | Minor | - | Intermediate | Major | Minor |
To determine price objectives, it is also possible to use the pivot points. Here is the price position in relation to pivot points:
| Pivot points | S3 | S2 | S1 | PP | R1 | R2 | R3 |
|---|---|---|---|---|---|---|---|
| Standard | 1.3258 | 1.3288 | 1.3333 | 1.3363 | 1.3408 | 1.3438 | 1.3483 |
| Camarilla | 1.3356 | 1.3363 | 1.3370 | 1.3377 | 1.3384 | 1.3391 | 1.3398 |
| Woodie | 1.3265 | 1.3292 | 1.3340 | 1.3367 | 1.3415 | 1.3442 | 1.3490 |
| Fibonacci | 1.3288 | 1.3317 | 1.3335 | 1.3363 | 1.3392 | 1.3410 | 1.3438 |
| Pivot points | S3 | S2 | S1 | PP | R1 | R2 | R3 |
|---|---|---|---|---|---|---|---|
| Standard | 1.3155 | 1.3220 | 1.3278 | 1.3343 | 1.3401 | 1.3466 | 1.3524 |
| Camarilla | 1.3303 | 1.3315 | 1.3326 | 1.3337 | 1.3348 | 1.3360 | 1.3371 |
| Woodie | 1.3153 | 1.3218 | 1.3276 | 1.3341 | 1.3399 | 1.3464 | 1.3522 |
| Fibonacci | 1.3220 | 1.3267 | 1.3296 | 1.3343 | 1.3390 | 1.3419 | 1.3466 |
| Pivot points | S3 | S2 | S1 | PP | R1 | R2 | R3 |
|---|---|---|---|---|---|---|---|
| Standard | 1.2758 | 1.3021 | 1.3196 | 1.3459 | 1.3634 | 1.3897 | 1.4072 |
| Camarilla | 1.3251 | 1.3291 | 1.3331 | 1.3371 | 1.3411 | 1.3451 | 1.3492 |
| Woodie | 1.2714 | 1.2999 | 1.3152 | 1.3437 | 1.3590 | 1.3875 | 1.4028 |
| Fibonacci | 1.3021 | 1.3188 | 1.3292 | 1.3459 | 1.3626 | 1.3730 | 1.3897 |
Numerical data
The following is the status of technical indicators and moving averages registered at the time this technical analysis was created:
| RSI (14): | 71.74 | |
| MACD (12,26,9): | 0.0009 | |
| Directional Movement: | 7.1832 | |
| AROON (14): | 7.1429 | |
| DEMA (21): | 1.3400 | |
| Parabolic SAR (0,02-0,02-0,2): | 1.3375 | |
| Elder Ray (13): | 0.0013 | |
| Super Trend (3,10): | 1.3366 | |
| Zig ZAG (10): | 1.3418 | |
| VORTEX (21): | 1.0558 | |
| Stochastique (14,3,5): | 85.50 | |
| TEMA (21): | 1.3404 | |
| Williams %R (14): | -2.33 | |
| Chande Momentum Oscillator (20): | 0.0034 | |
| Repulse (5,40,3): | 0.2801 | |
| ROCnROLL: | 1 | |
| TRIX (15,9): | 0.0085 | |
| Courbe Coppock: | 0.26 |
| MA7: | 1.3356 | |
| MA20: | 1.3437 | |
| MA50: | 1.3577 | |
| MA100: | 1.3546 | |
| MAexp7: | 1.3400 | |
| MAexp20: | 1.3389 | |
| MAexp50: | 1.3375 | |
| MAexp100: | 1.3367 | |
| Price / MA7: | +0.45% | |
| Price / MA20: | -0.16% | |
| Price / MA50: | -1.19% | |
| Price / MA100: | -0.96% | |
| Price / MAexp7: | +0.12% | |
| Price / MAexp20: | +0.20% | |
| Price / MAexp50: | +0.31% | |
| Price / MAexp100: | +0.37% |
News
The latest news and videos published on USD/SGD at the time of the analysis were as follows:
-
 USD/SGD and USD/ZAR Forecast May 17, 2022
-
USD/SGD and USD/ZAR Forecast February 28, 2022
-
USD/SGD and USD/ZAR Forecast February 9, 2022
-
USD/SGD "To Hit 2009 Highs"
-
USD/SGD Weakening Trend
About author

Online


Add a comment
Comments
0 comments on the analysis USD/SGD - 1H