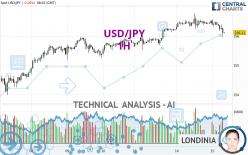
USD/JPY - 1H - Technical analysis published on 05/15/2024 (GMT)
- 76
- 0
Click here for a new analysis!
- Timeframe : 1H
- - Analysis generated on
- Status : TARGET REACHED

Summary of the analysis

Additional analysis
Quotes
The USD/JPY rating is 156.11 JPY. On the day, this instrument lost -0.26% and was traded between 155.96 JPY and 156.56 JPY over the period. The price is currently at +0.10% from its lowest and -0.29% from its highest.A study of price movements over other periods shows the following variations:
Near a new HIGH record (5 years)
Type : Bullish
Timeframe : Weekly
Near a new HIGH record (1 year)
Type : Bullish
Timeframe : Weekly
Near a new HIGH record (1st january)
Type : Bullish
Timeframe : Weekly
Near a new LOW record (1 month)
Type : Bearish
Timeframe : Weekly
Technical
A technical analysis in 1H of this USD/JPY chart shows a slightly bullish trend. 57.14% of the signals given by moving averages are bullish. Caution: the strong bearish signals currently being given by short-term moving averages indicate that this slightly bullish trend could be reversed. The Central Indicators market scanner is currently detecting a bearish signal that could impact this trend:
Bearish price crossover with adaptative moving average 100
Type : Bearish
Timeframe : 1 hour
An assessment of technical indicators shows a strong bearish signal.
But beware of excesses. The Central Indicators scanner currently detects this:
CCI indicator is oversold : under -100
Type : Neutral
Timeframe : 1 hour
Williams %R indicator is oversold : under -80
Type : Neutral
Timeframe : 1 hour
Pivot points : price is under support 1
Type : Neutral
Timeframe : 1 hour
SuperTrend indicator bearish reversal
Type : Bearish
Timeframe : 1 hour
MACD indicator is back under 0
Type : Bearish
Timeframe : 1 hour
Central Patterns, the market scanner focusing on chart patterns, resistances and supports found these results:
Near horizontal support
Type : Bullish
Timeframe : 1 hour
Support of channel is broken
Type : Bearish
Timeframe : 1 hour
The Central Candlesticks scanner which studies Japanese candlesticks did not detect anything.
| S3 | S2 | S1 | Price | R1 | R2 | |
|---|---|---|---|---|---|---|
| ProTrendLines | 154.00 | 154.70 | 155.96 | 156.11 | 156.78 | 158.33 |
| Change (%) | -1.35% | -0.90% | -0.10% | - | +0.43% | +1.42% |
| Change | -2.11 | -1.41 | -0.15 | - | +0.67 | +2.22 |
| Level | Intermediate | Minor | Major | - | Intermediate | Intermediate |
Attention could also be paid to pivot points to set price objectives:
| Pivot points | S3 | S2 | S1 | PP | R1 | R2 | R3 |
|---|---|---|---|---|---|---|---|
| Standard | 155.69 | 155.96 | 156.24 | 156.51 | 156.79 | 157.06 | 157.34 |
| Camarilla | 156.37 | 156.42 | 156.47 | 156.52 | 156.57 | 156.62 | 156.67 |
| Woodie | 155.70 | 155.96 | 156.25 | 156.51 | 156.80 | 157.06 | 157.35 |
| Fibonacci | 155.96 | 156.17 | 156.30 | 156.51 | 156.72 | 156.85 | 157.06 |
| Pivot points | S3 | S2 | S1 | PP | R1 | R2 | R3 |
|---|---|---|---|---|---|---|---|
| Standard | 150.57 | 151.68 | 153.73 | 154.84 | 156.89 | 158.00 | 160.05 |
| Camarilla | 154.90 | 155.19 | 155.48 | 155.77 | 156.06 | 156.35 | 156.64 |
| Woodie | 151.03 | 151.92 | 154.19 | 155.08 | 157.35 | 158.24 | 160.51 |
| Fibonacci | 151.68 | 152.89 | 153.64 | 154.84 | 156.05 | 156.80 | 158.00 |
| Pivot points | S3 | S2 | S1 | PP | R1 | R2 | R3 |
|---|---|---|---|---|---|---|---|
| Standard | 142.88 | 146.84 | 152.30 | 156.26 | 161.72 | 165.68 | 171.14 |
| Camarilla | 155.16 | 156.02 | 156.89 | 157.75 | 158.61 | 159.48 | 160.34 |
| Woodie | 143.62 | 147.22 | 153.04 | 156.64 | 162.46 | 166.06 | 171.88 |
| Fibonacci | 146.84 | 150.44 | 152.67 | 156.26 | 159.86 | 162.09 | 165.68 |
Numerical data
The following is the status of the technical indicators and moving averages at the time of publication of this technical analysis:
| RSI (14): | 33.59 | |
| MACD (12,26,9): | -0.0200 | |
| Directional Movement: | -18.58 | |
| AROON (14): | -50.00 | |
| DEMA (21): | 156.35 | |
| Parabolic SAR (0,02-0,02-0,2): | 156.60 | |
| Elder Ray (13): | -0.21 | |
| Super Trend (3,10): | 156.57 | |
| Zig ZAG (10): | 156.06 | |
| VORTEX (21): | 0.8800 | |
| Stochastique (14,3,5): | 19.79 | |
| TEMA (21): | 156.26 | |
| Williams %R (14): | -81.67 | |
| Chande Momentum Oscillator (20): | -0.39 | |
| Repulse (5,40,3): | -0.1900 | |
| ROCnROLL: | 2 | |
| TRIX (15,9): | 0.0000 | |
| Courbe Coppock: | 0.21 |
| MA7: | 155.74 | |
| MA20: | 155.42 | |
| MA50: | 152.75 | |
| MA100: | 150.21 | |
| MAexp7: | 156.28 | |
| MAexp20: | 156.35 | |
| MAexp50: | 156.25 | |
| MAexp100: | 156.01 | |
| Price / MA7: | +0.24% | |
| Price / MA20: | +0.44% | |
| Price / MA50: | +2.20% | |
| Price / MA100: | +3.93% | |
| Price / MAexp7: | -0.11% | |
| Price / MAexp20: | -0.15% | |
| Price / MAexp50: | -0.09% | |
| Price / MAexp100: | +0.06% |
News
Don't forget to follow the news on USD/JPY. At the time of publication of this analysis, the latest news was as follows:
-
 USD/JPY Daily Forecast and Technical Analysis for May 14, 2024, by Chris Lewis for FX Empire
-
USD/JPY Forecast May 14, 2024
-
USD/JPY Daily Forecast and Technical Analysis for May 13, 2024, by Chris Lewis for FX Empire
-
USD/JPY Forecast May 13, 2024
-
USD/JPY Long Term Forecast and Technical Analysis for May 10, 2024, by Chris Lewis for FX Empire
About author

Online


Add a comment
Comments
0 comments on the analysis USD/JPY - 1H