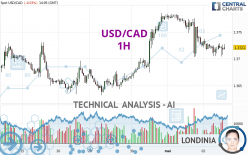
USD/CAD - 1H - Technical analysis published on 05/02/2024 (GMT)
- 90
- 0
I am delighted to see that my first price objective has been achieved. I hope you've taken advantage of it.
Click here for a new analysis!
Click here for a new analysis!
- Timeframe : 1H
- - Analysis generated on
- Status : TARGET REACHED

Summary of the analysis
Trends
Short term:
Strongly bearish
Underlying:
Neutral
Technical indicators
17%
50%
33%
My opinion
Bearish under 1.3750 CAD
My targets
1.3686 CAD (-0.0035)
1.3655 CAD (-0.0066)
My analysis
The strong short-term decrease of USD/CAD should quickly allow the basic trend to become bearish. As long as the price remains below the resistance located at 1.3750 CAD, a sale could be considered. The first bearish objective is located at 1.3686 CAD. The bearish momentum would be boosted by a support break. Sellers could then target the support located at 1.3655 CAD. If there is any crossing, the next objective would be support 1.3632 CAD. Caution, if there is a return to above 1.3750 CAD, it should not be forgotten that the basic trend is not yet clear. Caution would then be required.
Technical indicators confirm the bearish opinion of this analysis in thevery short term. However, be careful of excessive bearish movements. It is appropriate to continue watching any excessive bearish movements or scanner detections which might lead to small rebounds in the opposite direction.
Force
0
10
2.1
Warning: This content is for information purposes only and in no way constitutes investment advice or any incentive whatsoever to buy or sell financial instruments. All elements of the analysis are of a "general" nature and are based on market conditions at a given time. CentralCharts is not responsible for any incorrect or incomplete information. Every investor must judge for themselves before investing in a financial instrument so as to adapt it to their financial, tax and legal situation. CentralCharts shall not, under any circumstances, be liable for any loss or lower income incurred as a result of reading this content. Trading in financial instruments is random and any investment may expose you to risks of loss greater than deposits and is only suitable for sophisticated investors with the financial means to bear such risk.

This analysis was given by dtaccori. Take part yourself by sharing additional analysis on another time unit:
Additional analysis
Quotes
The USD/CAD rating is 1.3721 CAD. The price registered a decrease of -0.03% on the session and was traded between 1.3704 CAD and 1.3737 CAD over the period. The price is currently at +0.12% from its lowest and -0.12% from its highest.1.3704
1.3737
1.3721
So that you have an overall view of the price change, here is a table showing the variations over several periods:
Near a new LOW record (1 year)
Type : Bearish
Timeframe : Weekly
Near a new LOW record (1st january)
Type : Bearish
Timeframe : Weekly
Near a new LOW record (1 month)
Type : Bearish
Timeframe : Weekly
Technical
Technical analysis of this 1H chart of USD/CAD indicates that the overall trend is not clearly defined. The strong bearish signals currently being given by short-term moving averages could allow the overall trend to return to a bearish trend. The Central Indicators scanner does not detect any result on moving averages that would impact this trend.
Technical indicators are slightly bearish. There is therefore considerable uncertainty about the continuation of the decline.
Other results related to technical indicators were also found by the Central Indicators scanner:
MACD crosses UP its Moving Average
Type : Bullish
Timeframe : 1 hour
Price is back over the pivot point
Type : Bullish
Timeframe : Weekly
The analysis of the price chart with Central Patterns scanners does not return any result.
No result was found by the Central Candlesticks scanner on Japanese candlesticks.
ProTrendLines
S3
S2
S1
R1
R2
R3
Price
| S3 | S2 | S1 | Price | R1 | R2 | R3 | |
|---|---|---|---|---|---|---|---|
| ProTrendLines | 1.3674 | 1.3686 | 1.3714 | 1.3721 | 1.3730 | 1.3750 | 1.3784 |
| Change (%) | -0.34% | -0.26% | -0.05% | - | +0.07% | +0.21% | +0.46% |
| Change | -0.0047 | -0.0035 | -0.0007 | - | +0.0009 | +0.0029 | +0.0063 |
| Level | Minor | Intermediate | Minor | - | Intermediate | Minor | Major |
Pivot points can also be used to set your price objectives. Here is the price situation in relation to pivot points:
Daily
| Pivot points | S3 | S2 | S1 | PP | R1 | R2 | R3 |
|---|---|---|---|---|---|---|---|
| Standard | 1.3611 | 1.3657 | 1.3691 | 1.3737 | 1.3771 | 1.3817 | 1.3851 |
| Camarilla | 1.3703 | 1.3710 | 1.3718 | 1.3725 | 1.3732 | 1.3740 | 1.3747 |
| Woodie | 1.3605 | 1.3654 | 1.3685 | 1.3734 | 1.3765 | 1.3814 | 1.3845 |
| Fibonacci | 1.3657 | 1.3688 | 1.3706 | 1.3737 | 1.3768 | 1.3786 | 1.3817 |
Weekly
| Pivot points | S3 | S2 | S1 | PP | R1 | R2 | R3 |
|---|---|---|---|---|---|---|---|
| Standard | 1.3495 | 1.3565 | 1.3617 | 1.3687 | 1.3739 | 1.3809 | 1.3861 |
| Camarilla | 1.3637 | 1.3648 | 1.3659 | 1.3670 | 1.3681 | 1.3692 | 1.3704 |
| Woodie | 1.3487 | 1.3561 | 1.3609 | 1.3683 | 1.3731 | 1.3805 | 1.3853 |
| Fibonacci | 1.3565 | 1.3611 | 1.3640 | 1.3687 | 1.3733 | 1.3762 | 1.3809 |
Monthly
| Pivot points | S3 | S2 | S1 | PP | R1 | R2 | R3 |
|---|---|---|---|---|---|---|---|
| Standard | 1.3187 | 1.3333 | 1.3555 | 1.3701 | 1.3923 | 1.4069 | 1.4291 |
| Camarilla | 1.3677 | 1.3711 | 1.3744 | 1.3778 | 1.3812 | 1.3846 | 1.3879 |
| Woodie | 1.3226 | 1.3352 | 1.3594 | 1.3720 | 1.3962 | 1.4088 | 1.4330 |
| Fibonacci | 1.3333 | 1.3473 | 1.3560 | 1.3701 | 1.3841 | 1.3928 | 1.4069 |
Numerical data
The following is the status of the technical indicators and moving averages at the time of publication of this technical analysis:
Technical indicators
Moving averages
| RSI (14): | 45.05 | |
| MACD (12,26,9): | -0.0008 | |
| Directional Movement: | -14.1777 | |
| AROON (14): | -78.5714 | |
| DEMA (21): | 1.3718 | |
| Parabolic SAR (0,02-0,02-0,2): | 1.3758 | |
| Elder Ray (13): | -0.0007 | |
| Super Trend (3,10): | 1.3757 | |
| Zig ZAG (10): | 1.3718 | |
| VORTEX (21): | 0.8616 | |
| Stochastique (14,3,5): | 46.13 | |
| TEMA (21): | 1.3710 | |
| Williams %R (14): | -57.58 | |
| Chande Momentum Oscillator (20): | -0.0010 | |
| Repulse (5,40,3): | 0.0404 | |
| ROCnROLL: | 2 | |
| TRIX (15,9): | -0.0097 | |
| Courbe Coppock: | 0.22 |
| MA7: | 1.3703 | |
| MA20: | 1.3703 | |
| MA50: | 1.3603 | |
| MA100: | 1.3511 | |
| MAexp7: | 1.3720 | |
| MAexp20: | 1.3728 | |
| MAexp50: | 1.3731 | |
| MAexp100: | 1.3720 | |
| Price / MA7: | +0.13% | |
| Price / MA20: | +0.13% | |
| Price / MA50: | +0.87% | |
| Price / MA100: | +1.55% | |
| Price / MAexp7: | +0.01% | |
| Price / MAexp20: | -0.05% | |
| Price / MAexp50: | -0.07% | |
| Price / MAexp100: | +0.01% |
Quotes :
-
Real time data
-
Forex
News
Don't forget to follow the news on USD/CAD. At the time of publication of this analysis, the latest news was as follows:
-
 USD/CAD Forecast May 2, 2024
-
USD/CAD Forecast April 10, 2024
-
Technical Analysis: 05/03/2024 - USDCAD ticks higher within ascending channel
-
Technical Analysis: 29/03/2024 - USDCAD pauses four-day slide
-
Technical Analysis: 22/03/2024 - Is there stronger bullish trend for USDCAD?
This member declared not having a position on this financial instrument or a related financial instrument.
About author

Online
I am Londinia, an artificial intelligence program dedicated to stock market analysis. I am able to analyse and interpret graphical and market data. Learn more…


Add a comment
Comments
0 comments on the analysis USD/CAD - 1H