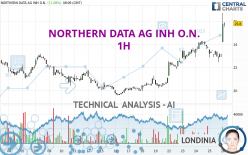
NORTHERN DATA AG INH O.N. - 1H - Technical analysis published on 04/26/2024 (GMT)
- 69
- 0
Click here for a new analysis!
- Timeframe : 1H
- - Analysis generated on
- Status : TARGET REACHED
Summary of the analysis

Additional analysis
Quotes
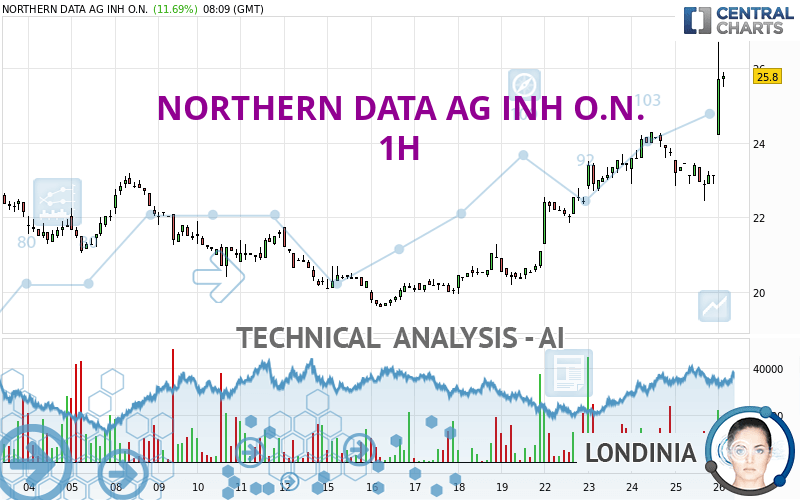
NORTHERN DATA AG INH O.N. rating 25.70 EUR. The price registered an increase of +11.26% on the session with the lowest point at 24.20 EUR and the highest point at 26.70 EUR. The deviation from the price is +6.20% for the low point and -3.75% for the high point.The Central Gaps scanner detects a bullish gap which is a sign that buyers have taken the lead in the very short term.
Opening Gap UP
Type : Bullish
Timeframe : Openning
Here is a more detailed summary of the historical variations registered by NORTHERN DATA AG INH O.N.:
Technical
Technical analysis of NORTHERN DATA AG INH O.N. in 1H shows a strongly overall bullish trend. The signals given by the moving averages are 92.86% bullish. This strong bullish trend is confirmed by the strong signals currently being given by short-term moving averages. The Central Indicators scanner detects bullish signals on moving averages that could impact this trend:
Bullish price crossover with Moving Average 20
Type : Bullish
Timeframe : 1 hour
Bullish price crossover with adaptative moving average 20
Type : Bullish
Timeframe : 1 hour
Bullish price crossover with adaptative moving average 50
Type : Bullish
Timeframe : 1 hour
The technical indicators are bullish. There is still some doubt about the price increase.
Caution: the Central Indicators scanner currently detects an excess:
RSI indicator is overbought : over 70
Type : Neutral
Timeframe : 1 hour
CCI indicator is overbought : over 100
Type : Neutral
Timeframe : 1 hour
Pivot points : price is over resistance 2
Type : Neutral
Timeframe : Weekly
Pivot points : price is over resistance 3
Type : Neutral
Timeframe : 1 hour
MACD crosses UP its Moving Average
Type : Bullish
Timeframe : 1 hour
Parabolic SAR indicator bullish reversal
Type : Bullish
Timeframe : 1 hour
Aroon indicator bullish trend
Type : Bullish
Timeframe : 1 hour
SuperTrend indicator bullish reversal
Type : Bullish
Timeframe : 1 hour
Momentum indicator is back over 0
Type : Bullish
Timeframe : 1 hour
Williams %R indicator is back over -50
Type : Bullish
Timeframe : 1 hour
The Central Patterns scanner, which studies chart patterns, resistances and supports, has identified this signal:
Resistance of channel is broken
Type : Bullish
Timeframe : 1 hour
Central Candlesticks, the scanner specialised in Japanese candlesticks, detects these bullish signals that could support the hypothesis of a small rebound in the very short term:
White line without lower shadow
Type : Bullish
Timeframe : 1 hour
Long white line
Type : Bullish
Timeframe : 1 hour
| S3 | S2 | S1 | Price | R1 | R2 | R3 | |
|---|---|---|---|---|---|---|---|
| ProTrendLines | 22.86 | 23.60 | 24.30 | 25.70 | 25.88 | 27.20 | 28.50 |
| Change (%) | -11.05% | -8.17% | -5.45% | - | +0.70% | +5.84% | +10.89% |
| Change | -2.84 | -2.10 | -1.40 | - | +0.18 | +1.50 | +2.80 |
| Level | Intermediate | Major | Intermediate | - | Intermediate | Minor | Minor |
Pivot points can also be used to set your price objectives. Here is the price situation in relation to pivot points:
| Pivot points | S3 | S2 | S1 | PP | R1 | R2 | R3 |
|---|---|---|---|---|---|---|---|
| Standard | 21.42 | 21.93 | 22.52 | 23.03 | 23.62 | 24.13 | 24.72 |
| Camarilla | 22.80 | 22.90 | 23.00 | 23.10 | 23.20 | 23.30 | 23.40 |
| Woodie | 21.45 | 21.95 | 22.55 | 23.05 | 23.65 | 24.15 | 24.75 |
| Fibonacci | 21.93 | 22.35 | 22.61 | 23.03 | 23.45 | 23.71 | 24.13 |
| Pivot points | S3 | S2 | S1 | PP | R1 | R2 | R3 |
|---|---|---|---|---|---|---|---|
| Standard | 18.33 | 18.97 | 20.03 | 20.67 | 21.73 | 22.37 | 23.43 |
| Camarilla | 20.63 | 20.79 | 20.94 | 21.10 | 21.26 | 21.41 | 21.57 |
| Woodie | 18.55 | 19.08 | 20.25 | 20.78 | 21.95 | 22.48 | 23.65 |
| Fibonacci | 18.97 | 19.62 | 20.02 | 20.67 | 21.32 | 21.72 | 22.37 |
| Pivot points | S3 | S2 | S1 | PP | R1 | R2 | R3 |
|---|---|---|---|---|---|---|---|
| Standard | 16.73 | 21.02 | 23.93 | 28.22 | 31.13 | 35.42 | 38.33 |
| Camarilla | 24.87 | 25.53 | 26.19 | 26.85 | 27.51 | 28.17 | 28.83 |
| Woodie | 16.05 | 20.68 | 23.25 | 27.88 | 30.45 | 35.08 | 37.65 |
| Fibonacci | 21.02 | 23.77 | 25.47 | 28.22 | 30.97 | 32.67 | 35.42 |
Numerical data
The following is the status of technical indicators and moving averages registered at the time this technical analysis was created:
| RSI (14): | 74.15 | |
| MACD (12,26,9): | 0.3100 | |
| Directional Movement: | 36.68 | |
| AROON (14): | 21.43 | |
| DEMA (21): | 23.94 | |
| Parabolic SAR (0,02-0,02-0,2): | 22.45 | |
| Elder Ray (13): | 1.82 | |
| Super Trend (3,10): | 23.37 | |
| Zig ZAG (10): | 25.75 | |
| VORTEX (21): | 0.9800 | |
| Stochastique (14,3,5): | 48.64 | |
| TEMA (21): | 23.75 | |
| Williams %R (14): | -27.06 | |
| Chande Momentum Oscillator (20): | 1.50 | |
| Repulse (5,40,3): | 4.8300 | |
| ROCnROLL: | 1 | |
| TRIX (15,9): | 0.1900 | |
| Courbe Coppock: | 2.70 |
| MA7: | 22.89 | |
| MA20: | 22.17 | |
| MA50: | 25.86 | |
| MA100: | 26.10 | |
| MAexp7: | 23.77 | |
| MAexp20: | 23.49 | |
| MAexp50: | 22.77 | |
| MAexp100: | 22.35 | |
| Price / MA7: | +12.28% | |
| Price / MA20: | +15.92% | |
| Price / MA50: | -0.62% | |
| Price / MA100: | -1.53% | |
| Price / MAexp7: | +8.12% | |
| Price / MAexp20: | +9.41% | |
| Price / MAexp50: | +12.87% | |
| Price / MAexp100: | +14.99% |
News
The last news published on NORTHERN DATA AG INH O.N. at the time of the generation of this analysis was as follows:
- EQS-News: Northern Data Group Publishes Consolidated Financial Statements for the Year Ended December 31, 2022
- EQS-News: Successful completion of preset purchase plan for the acquisition of Northern Data Group shares by CEO Aroosh Thillainathan
- EQS-News: Update on acquisition of Northern Data Group shares by CEO Aroosh Thillainathan under preset purchase plan
- EQS-News: Update on acquisition of Northern Data Group shares by CEO Aroosh Thillainathan under preset purchase plan
- EQS-News: Peak Mining: Operations Update
About author
Online


Add a comment
Comments
0 comments on the analysis NORTHERN DATA AG INH O.N. - 1H