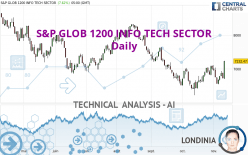
S&P GLOB 1200 INFO TECH SECTOR - Daily - Technical analysis published on 11/11/2022 (GMT)
- 166
- 0
Click here for a new analysis!
- Timeframe : Daily
- - Analysis generated on
- Status : TARGET REACHED

Summary of the analysis

Additional analysis
Quotes
The S&P GLOB 1200 INFO TECH SECTOR price is 7,232.47 USD. The price has increased by +7.62% since the last closing with the lowest point at 6,699.31 USD and the highest point at 7,233.40 USD. The deviation from the price is +7.96% for the low point and -0.01% for the high point.The Central Gaps scanner detects a bullish opening. A small advantage for buyers in the very short term.
Bullish opening
Type : Bullish
Timeframe : Openning
A study of price movements over other periods shows the following variations:
New HIGH record (1 month)
Type : Bullish
Timeframe : Weekly
Technical
Technical analysis of S&P GLOB 1200 INFO TECH SECTOR in Daily shows an overall bullish trend. 64.29% of the signals given by moving averages are bullish. The overall trend is reinforced by the strong bullish signals from short-term moving averages. The Central Indicators market scanner is currently detecting several bullish signals that could impact this trend:
Bullish trend reversal : Moving Average 100
Type : Bullish
Timeframe : Daily
Bullish trend reversal : adaptative moving average 50
Type : Bullish
Timeframe : Daily
Bullish trend reversal : adaptative moving average 100
Type : Bullish
Timeframe : Daily
Bullish price crossover with Moving Average 100
Type : Bullish
Timeframe : Daily
Bullish price crossover with adaptative moving average 100
Type : Bullish
Timeframe : Daily
In fact, 15 technical indicators on 18 studied are currently bullish. Caution: the Central Indicators scanner currently detects an excess:
CCI indicator is overbought : over 100
Type : Neutral
Timeframe : Daily
Williams %R indicator is overbought : over -20
Type : Neutral
Timeframe : Daily
Pivot points : price is over resistance 1
Type : Neutral
Timeframe : Weekly
No signals are given by Central Patterns, a market scanner specialised in chart patterns, resistances and supports.
The presence of a bearish pattern in Japanese candlesticks detected by Central Candlesticks that could cause a correction in the very short term was also detected:
Bearish doji star
Type : Bearish
Timeframe : Daily
| S3 | S2 | S1 | Price | R1 | R2 | R3 | |
|---|---|---|---|---|---|---|---|
| ProTrendLines | 5,947.36 | 6,430.07 | 6,914.93 | 7,232.47 | 7,336.94 | 7,988.02 | 8,305.28 |
| Change (%) | -17.77% | -11.09% | -4.39% | - | +1.44% | +10.45% | +14.83% |
| Change | -1,285.11 | -802.40 | -317.54 | - | +104.47 | +755.55 | +1,072.81 |
| Level | Intermediate | Intermediate | Major | - | Minor | Intermediate | Minor |
Attention could also be paid to pivot points to set price objectives:
| Pivot points | S3 | S2 | S1 | PP | R1 | R2 | R3 |
|---|---|---|---|---|---|---|---|
| Standard | 7,135.38 | 7,182.48 | 7,271.40 | 7,318.50 | 7,407.42 | 7,454.52 | 7,543.44 |
| Camarilla | 7,322.91 | 7,335.37 | 7,347.84 | 7,360.31 | 7,372.78 | 7,385.25 | 7,397.72 |
| Woodie | 7,156.28 | 7,192.94 | 7,292.30 | 7,328.96 | 7,428.32 | 7,464.98 | 7,564.34 |
| Fibonacci | 7,182.48 | 7,234.44 | 7,266.54 | 7,318.50 | 7,370.46 | 7,402.56 | 7,454.52 |
| Pivot points | S3 | S2 | S1 | PP | R1 | R2 | R3 |
|---|---|---|---|---|---|---|---|
| Standard | 5,868.83 | 6,203.10 | 6,435.77 | 6,770.04 | 7,002.71 | 7,336.98 | 7,569.65 |
| Camarilla | 6,512.53 | 6,564.50 | 6,616.47 | 6,668.44 | 6,720.41 | 6,772.38 | 6,824.35 |
| Woodie | 5,818.03 | 6,177.70 | 6,384.97 | 6,744.64 | 6,951.91 | 7,311.58 | 7,518.85 |
| Fibonacci | 6,203.10 | 6,419.67 | 6,553.47 | 6,770.04 | 6,986.61 | 7,120.41 | 7,336.98 |
| Pivot points | S3 | S2 | S1 | PP | R1 | R2 | R3 |
|---|---|---|---|---|---|---|---|
| Standard | 5,577.12 | 5,898.41 | 6,451.52 | 6,772.81 | 7,325.92 | 7,647.21 | 8,200.32 |
| Camarilla | 6,764.16 | 6,844.31 | 6,924.47 | 7,004.62 | 7,084.77 | 7,164.93 | 7,245.08 |
| Woodie | 5,693.02 | 5,956.37 | 6,567.42 | 6,830.77 | 7,441.82 | 7,705.17 | 8,316.22 |
| Fibonacci | 5,898.41 | 6,232.43 | 6,438.79 | 6,772.81 | 7,106.83 | 7,313.19 | 7,647.21 |
Numerical data
The following is the status of technical indicators and moving averages registered at the time this technical analysis was created:
| RSI (14): | 62.92 | |
| MACD (12,26,9): | 49.3100 | |
| Directional Movement: | 14.33 | |
| AROON (14): | 42.86 | |
| DEMA (21): | 6,916.81 | |
| Parabolic SAR (0,02-0,02-0,2): | 6,551.29 | |
| Elder Ray (13): | 349.94 | |
| Super Trend (3,10): | 6,733.70 | |
| Zig ZAG (10): | 7,295.35 | |
| VORTEX (21): | 1.1900 | |
| Stochastique (14,3,5): | 77.23 | |
| TEMA (21): | 7,027.79 | |
| Williams %R (14): | 0.00 | |
| Chande Momentum Oscillator (20): | 220.35 | |
| Repulse (5,40,3): | 6.7300 | |
| ROCnROLL: | 1 | |
| TRIX (15,9): | 0.0200 | |
| Courbe Coppock: | 1.16 |
| MA7: | 6,889.76 | |
| MA20: | 6,878.42 | |
| MA50: | 6,835.89 | |
| MA100: | 7,243.13 | |
| MAexp7: | 6,987.61 | |
| MAexp20: | 6,877.79 | |
| MAexp50: | 6,946.38 | |
| MAexp100: | 7,200.42 | |
| Price / MA7: | +4.97% | |
| Price / MA20: | +5.15% | |
| Price / MA50: | +5.80% | |
| Price / MA100: | -0.15% | |
| Price / MAexp7: | +3.50% | |
| Price / MAexp20: | +5.16% | |
| Price / MAexp50: | +4.12% | |
| Price / MAexp100: | +0.45% |
About author
Online


Add a comment
Comments
0 comments on the analysis S&P GLOB 1200 INFO TECH SECTOR - Daily