S&P EUROPE 350 INFO TECH SECTOR - Daily - Technical analysis published on 01/05/2023 (GMT)
- 100
- 0
- Timeframe : Daily
- - Analysis generated on
- Status : NEUTRAL
Summary of the analysis

Additional analysis
Quotes
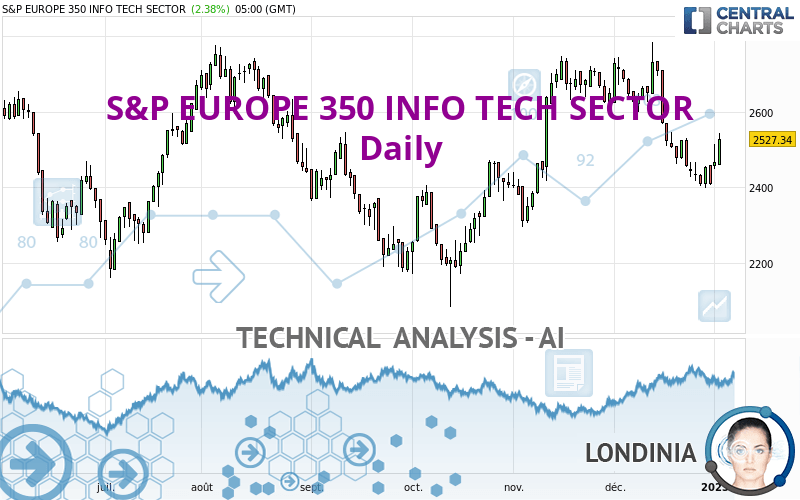
The S&P EUROPE 350 INFO TECH SECTOR rating is 2,527.34 EUR. The price has increased by +2.38% since the last closing with the lowest point at 2,459.65 EUR and the highest point at 2,543.04 EUR. The deviation from the price is +2.75% for the low point and -0.62% for the high point.The Central Gaps scanner detects a bearish opening marking the presence of sellers ahead of buyers at the opening but not sufficiently marked to allow the price to register a quotation gap.
Bearish opening
Type : Bearish
Timeframe : Openning
Here is a more detailed summary of the historical variations registered by S&P EUROPE 350 INFO TECH SECTOR:
New HIGH record (1st january)
Type : Bullish
Timeframe : Weekly
Near a new LOW record (1 month)
Type : Bearish
Timeframe : Weekly
Technical
A technical analysis in Daily of this S&P EUROPE 350 INFO TECH SECTOR chart shows a slightly bullish trend. Only 57.14% of the signals given by moving averages are bullish. This slightly bullish trend could return to neutral given the neutral signals also given by short-term moving averages. An assessment of moving averages reveals several bullish signals that could impact this trend:
Bullish price crossover with Moving Average 100
Type : Bullish
Timeframe : Daily
Bullish price crossover with adaptative moving average 50
Type : Bullish
Timeframe : Daily
Bullish price crossover with adaptative moving average 100
Type : Bullish
Timeframe : Daily
The technical indicators are generally neutral. They do not provide relevant information on the direction of future price movements.
Central Indicators, the detector scanner for these technical indicators has recently detected several signals:
Pivot points : price is over resistance 1
Type : Neutral
Timeframe : Daily
Pivot points : price is over resistance 3
Type : Neutral
Timeframe : Weekly
RSI indicator is back over 50
Type : Bullish
Timeframe : Daily
Momentum indicator is back over 0
Type : Bullish
Timeframe : Daily
No signals are given by Central Patterns, a market scanner specialised in chart patterns, resistances and supports.
No result was found by the Central Candlesticks scanner on Japanese candlesticks.
| S3 | S2 | S1 | Price | R1 | R2 | R3 | |
|---|---|---|---|---|---|---|---|
| ProTrendLines | 2,312.13 | 2,388.67 | 2,515.52 | 2,527.34 | 2,623.02 | 2,753.66 | 3,006.76 |
| Change (%) | -8.52% | -5.49% | -0.47% | - | +3.79% | +8.95% | +18.97% |
| Change | -215.21 | -138.67 | -11.82 | - | +95.68 | +226.32 | +479.42 |
| Level | Minor | Intermediate | Major | - | Intermediate | Major | Minor |
Attention could also be paid to pivot points to set price objectives:
| Pivot points | S3 | S2 | S1 | PP | R1 | R2 | R3 |
|---|---|---|---|---|---|---|---|
| Standard | 2,502.07 | 2,509.98 | 2,517.26 | 2,525.17 | 2,532.45 | 2,540.36 | 2,547.64 |
| Camarilla | 2,520.37 | 2,521.77 | 2,523.16 | 2,524.55 | 2,525.94 | 2,527.34 | 2,528.73 |
| Woodie | 2,501.77 | 2,509.82 | 2,516.96 | 2,525.01 | 2,532.15 | 2,540.20 | 2,547.34 |
| Fibonacci | 2,509.98 | 2,515.78 | 2,519.36 | 2,525.17 | 2,530.97 | 2,534.55 | 2,540.36 |
| Pivot points | S3 | S2 | S1 | PP | R1 | R2 | R3 |
|---|---|---|---|---|---|---|---|
| Standard | 2,312.94 | 2,355.19 | 2,382.53 | 2,424.78 | 2,452.12 | 2,494.37 | 2,521.71 |
| Camarilla | 2,390.74 | 2,397.12 | 2,403.50 | 2,409.88 | 2,416.26 | 2,422.64 | 2,429.02 |
| Woodie | 2,305.50 | 2,351.46 | 2,375.09 | 2,421.05 | 2,444.68 | 2,490.64 | 2,514.27 |
| Fibonacci | 2,355.19 | 2,381.77 | 2,398.19 | 2,424.78 | 2,451.36 | 2,467.78 | 2,494.37 |
| Pivot points | S3 | S2 | S1 | PP | R1 | R2 | R3 |
|---|---|---|---|---|---|---|---|
| Standard | 1,890.16 | 2,143.79 | 2,276.84 | 2,530.47 | 2,663.52 | 2,917.15 | 3,050.20 |
| Camarilla | 2,303.54 | 2,338.99 | 2,374.43 | 2,409.88 | 2,445.33 | 2,480.77 | 2,516.22 |
| Woodie | 1,829.86 | 2,113.65 | 2,216.54 | 2,500.33 | 2,603.22 | 2,887.01 | 2,989.90 |
| Fibonacci | 2,143.79 | 2,291.51 | 2,382.76 | 2,530.47 | 2,678.19 | 2,769.44 | 2,917.15 |
Numerical data
The following is the status of the technical indicators and moving averages at the time of publication of this technical analysis:
| RSI (14): | 50.25 | |
| MACD (12,26,9): | -36.6700 | |
| Directional Movement: | 2.52 | |
| AROON (14): | -71.43 | |
| DEMA (21): | 2,471.81 | |
| Parabolic SAR (0,02-0,02-0,2): | 2,399.76 | |
| Elder Ray (13): | 10.50 | |
| Super Trend (3,10): | 2,593.73 | |
| Zig ZAG (10): | 2,527.34 | |
| VORTEX (21): | 0.8300 | |
| Stochastique (14,3,5): | 25.47 | |
| TEMA (21): | 2,424.50 | |
| Williams %R (14): | -58.46 | |
| Chande Momentum Oscillator (20): | 5.56 | |
| Repulse (5,40,3): | 3.1800 | |
| ROCnROLL: | 1 | |
| TRIX (15,9): | -0.1900 | |
| Courbe Coppock: | 13.71 |
| MA7: | 2,450.23 | |
| MA20: | 2,533.39 | |
| MA50: | 2,557.19 | |
| MA100: | 2,473.53 | |
| MAexp7: | 2,473.54 | |
| MAexp20: | 2,513.27 | |
| MAexp50: | 2,524.13 | |
| MAexp100: | 2,518.90 | |
| Price / MA7: | +3.15% | |
| Price / MA20: | -0.24% | |
| Price / MA50: | -1.17% | |
| Price / MA100: | +2.18% | |
| Price / MAexp7: | +2.18% | |
| Price / MAexp20: | +0.56% | |
| Price / MAexp50: | +0.13% | |
| Price / MAexp100: | +0.34% |
About author
Online


Add a comment
Comments
0 comments on the analysis S&P EUROPE 350 INFO TECH SECTOR - Daily