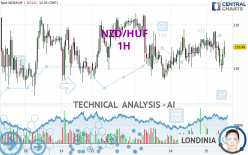
NZD/HUF - 1H - Technical analysis published on 04/25/2024 (GMT)
- 78
- 0
Click here for a new analysis!
- Timeframe : 1H
- - Analysis generated on
- Status : INVALID

Summary of the analysis

Additional analysis
Quotes
NZD/HUF rating 218.49 HUF. On the day, this instrument lost -0.01% and was between 217.91 HUF and 218.86 HUF. This implies that the price is at +0.27% from its lowest and at -0.17% from its highest.So that you have an overall view of the price change, here is a table showing the variations over several periods:
Near a new HIGH record (1 year)
Type : Bullish
Timeframe : Weekly
Near a new HIGH record (1st january)
Type : Bullish
Timeframe : Weekly
Near a new LOW record (1 month)
Type : Bearish
Timeframe : Weekly
Technical
A technical analysis in 1H of this NZD/HUF chart shows a bullish trend. 71.43% of the signals given by moving averages are bullish. The overall trend seems to be showing some signs of weakness, as do the tentative bullish signals given by short-term moving averages. The Central Indicators market scanner is currently detecting several bullish signals that could impact this trend:
Bullish price crossover with Moving Average 20
Type : Bullish
Timeframe : 1 hour
Bullish price crossover with Moving Average 50
Type : Bullish
Timeframe : 1 hour
Bullish price crossover with Moving Average 100
Type : Bullish
Timeframe : 1 hour
Bullish price crossover with adaptative moving average 20
Type : Bullish
Timeframe : 1 hour
In fact, only 9 technical indicators out of 18 studied are currently positioned bullish. Central Indicators, the detector scanner for these technical indicators has recently detected several signals:
RSI indicator is back over 50
Type : Bullish
Timeframe : 1 hour
Ichimoku : price is over the cloud
Type : Bullish
Timeframe : 1 hour
Price is back over the pivot point
Type : Bullish
Timeframe : 1 hour
Price is back over the pivot point
Type : Bullish
Timeframe : Weekly
Williams %R indicator is back over -50
Type : Bullish
Timeframe : 1 hour
An analysis of the price chart with the Central Patterns scanner (detector of chart patterns and resistances and supports) shows several results that can have an impact on the price change:
Near support of channel
Type : Bullish
Timeframe : 1 hour
Near support of triangle
Type : Bullish
Timeframe : 1 hour
The Central Candlesticks scanner, specialised in Japanese candlesticks, did not identify any signals.
| S3 | S2 | S1 | Price | R1 | R2 | R3 | |
|---|---|---|---|---|---|---|---|
| ProTrendLines | 217.38 | 217.69 | 218.20 | 218.49 | 218.57 | 218.89 | 219.18 |
| Change (%) | -0.51% | -0.37% | -0.13% | - | +0.04% | +0.18% | +0.32% |
| Change | -1.11 | -0.80 | -0.29 | - | +0.08 | +0.40 | +0.69 |
| Level | Minor | Intermediate | Minor | - | Minor | Intermediate | Major |
Pivot points can also be used to set your price objectives. Here is the price situation in relation to pivot points:
| Pivot points | S3 | S2 | S1 | PP | R1 | R2 | R3 |
|---|---|---|---|---|---|---|---|
| Standard | 217.09 | 217.53 | 218.02 | 218.46 | 218.95 | 219.39 | 219.88 |
| Camarilla | 218.26 | 218.35 | 218.44 | 218.52 | 218.61 | 218.69 | 218.78 |
| Woodie | 217.13 | 217.54 | 218.06 | 218.47 | 218.99 | 219.40 | 219.92 |
| Fibonacci | 217.53 | 217.88 | 218.10 | 218.46 | 218.81 | 219.03 | 219.39 |
| Pivot points | S3 | S2 | S1 | PP | R1 | R2 | R3 |
|---|---|---|---|---|---|---|---|
| Standard | 214.33 | 215.85 | 216.89 | 218.41 | 219.45 | 220.97 | 222.01 |
| Camarilla | 217.22 | 217.45 | 217.69 | 217.92 | 218.16 | 218.39 | 218.62 |
| Woodie | 214.08 | 215.73 | 216.64 | 218.29 | 219.20 | 220.85 | 221.76 |
| Fibonacci | 215.85 | 216.83 | 217.44 | 218.41 | 219.39 | 220.00 | 220.97 |
| Pivot points | S3 | S2 | S1 | PP | R1 | R2 | R3 |
|---|---|---|---|---|---|---|---|
| Standard | 207.98 | 212.96 | 215.55 | 220.53 | 223.12 | 228.10 | 230.69 |
| Camarilla | 216.06 | 216.75 | 217.45 | 218.14 | 218.83 | 219.53 | 220.22 |
| Woodie | 206.79 | 212.36 | 214.36 | 219.93 | 221.93 | 227.50 | 229.50 |
| Fibonacci | 212.96 | 215.85 | 217.64 | 220.53 | 223.42 | 225.21 | 228.10 |
Numerical data
The following are the details of the technical indicators and moving averages that were collected to generate this technical analysis:
| RSI (14): | 53.52 | |
| MACD (12,26,9): | -0.0100 | |
| Directional Movement: | 2.98 | |
| AROON (14): | -28.57 | |
| DEMA (21): | 218.43 | |
| Parabolic SAR (0,02-0,02-0,2): | 218.65 | |
| Elder Ray (13): | 0.05 | |
| Super Trend (3,10): | 218.95 | |
| Zig ZAG (10): | 218.54 | |
| VORTEX (21): | 1.0100 | |
| Stochastique (14,3,5): | 42.46 | |
| TEMA (21): | 218.37 | |
| Williams %R (14): | -49.47 | |
| Chande Momentum Oscillator (20): | -0.18 | |
| Repulse (5,40,3): | 0.0900 | |
| ROCnROLL: | 1 | |
| TRIX (15,9): | 0.0000 | |
| Courbe Coppock: | 0.14 |
| MA7: | 218.36 | |
| MA20: | 218.21 | |
| MA50: | 220.03 | |
| MA100: | 218.74 | |
| MAexp7: | 218.37 | |
| MAexp20: | 218.43 | |
| MAexp50: | 218.44 | |
| MAexp100: | 218.46 | |
| Price / MA7: | +0.06% | |
| Price / MA20: | +0.13% | |
| Price / MA50: | -0.70% | |
| Price / MA100: | -0.11% | |
| Price / MAexp7: | +0.05% | |
| Price / MAexp20: | +0.03% | |
| Price / MAexp50: | +0.02% | |
| Price / MAexp100: | +0.01% |
About author
Online


Add a comment
Comments
0 comments on the analysis NZD/HUF - 1H