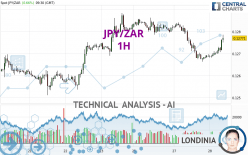
JPY/ZAR - 1H - Technical analysis published on 02/28/2024 (GMT)
- 91
- 0
Click here for a new analysis!
- Timeframe : 1H
- - Analysis generated on
- Status : INVALID

Summary of the analysis

Additional analysis
Quotes
The JPY/ZAR rating is 0.12772 ZAR. On the day, this instrument gained +0.67% with the lowest point at 0.12682 ZAR and the highest point at 0.12786 ZAR. The deviation from the price is +0.71% for the low point and -0.11% for the high point.Here is a more detailed summary of the historical variations registered by JPY/ZAR:
Near a new HIGH record (1st january)
Type : Bullish
Timeframe : Weekly
Near a new LOW record (1 month)
Type : Bearish
Timeframe : Weekly
Technical
A technical analysis in 1H of this JPY/ZAR chart shows a bullish trend. 71.43% of the signals given by moving averages are bullish. This bullish trend is supported by the strong bullish signals given by short-term moving averages. The Central Indicators market scanner is currently detecting several bullish signals that could impact this trend:
Bullish trend reversal : Moving Average 20
Type : Bullish
Timeframe : 1 hour
Bullish trend reversal : adaptative moving average 50
Type : Bullish
Timeframe : 1 hour
Bullish trend reversal : adaptative moving average 100
Type : Bullish
Timeframe : 1 hour
Bullish price crossover with Moving Average 50
Type : Bullish
Timeframe : 1 hour
Technical indicators are strongly bullish, suggesting that the price increase should continue.
Caution: the Central Indicators scanner currently detects an excess:
CCI indicator is overbought : over 100
Type : Neutral
Timeframe : 1 hour
Previous candle closed over Bollinger bands
Type : Neutral
Timeframe : 1 hour
Williams %R indicator is overbought : over -20
Type : Neutral
Timeframe : 1 hour
The Central Patterns scanner, which studies chart patterns, resistances and supports, has identified this signal:
Near resistance of channel
Type : Bearish
Timeframe : 1 hour
The Central Candlesticks scanner, specialised in Japanese candlesticks, did not identify any signals.
| S3 | S2 | S1 | Price | R1 | R2 | R3 | |
|---|---|---|---|---|---|---|---|
| ProTrendLines | 0.12663 | 0.12697 | 0.12752 | 0.12772 | 0.12842 | 0.12885 | 0.13147 |
| Change (%) | -0.85% | -0.59% | -0.16% | - | +0.55% | +0.88% | +2.94% |
| Change | -0.00109 | -0.00075 | -0.00020 | - | +0.00070 | +0.00113 | +0.00375 |
| Level | Major | Intermediate | Minor | - | Intermediate | Intermediate | Intermediate |
To determine price objectives, it is also possible to use the pivot points. Here is the price position in relation to pivot points:
| Pivot points | S3 | S2 | S1 | PP | R1 | R2 | R3 |
|---|---|---|---|---|---|---|---|
| Standard | 0.12440 | 0.12552 | 0.12619 | 0.12731 | 0.12798 | 0.12910 | 0.12977 |
| Camarilla | 0.12638 | 0.12654 | 0.12671 | 0.12687 | 0.12703 | 0.12720 | 0.12736 |
| Woodie | 0.12419 | 0.12541 | 0.12598 | 0.12720 | 0.12777 | 0.12899 | 0.12956 |
| Fibonacci | 0.12552 | 0.12620 | 0.12662 | 0.12731 | 0.12799 | 0.12841 | 0.12910 |
| Pivot points | S3 | S2 | S1 | PP | R1 | R2 | R3 |
|---|---|---|---|---|---|---|---|
| Standard | 0.12226 | 0.12369 | 0.12600 | 0.12743 | 0.12974 | 0.13117 | 0.13348 |
| Camarilla | 0.12729 | 0.12763 | 0.12798 | 0.12832 | 0.12866 | 0.12901 | 0.12935 |
| Woodie | 0.12271 | 0.12391 | 0.12645 | 0.12765 | 0.13019 | 0.13139 | 0.13393 |
| Fibonacci | 0.12369 | 0.12512 | 0.12600 | 0.12743 | 0.12886 | 0.12974 | 0.13117 |
| Pivot points | S3 | S2 | S1 | PP | R1 | R2 | R3 |
|---|---|---|---|---|---|---|---|
| Standard | 0.11941 | 0.12284 | 0.12493 | 0.12836 | 0.13045 | 0.13388 | 0.13597 |
| Camarilla | 0.12549 | 0.12600 | 0.12650 | 0.12701 | 0.12752 | 0.12802 | 0.12853 |
| Woodie | 0.11873 | 0.12251 | 0.12425 | 0.12803 | 0.12977 | 0.13355 | 0.13529 |
| Fibonacci | 0.12284 | 0.12495 | 0.12626 | 0.12836 | 0.13047 | 0.13178 | 0.13388 |
Numerical data
The following is the status of technical indicators and moving averages registered at the time this technical analysis was created:
| RSI (14): | 65.28 | |
| MACD (12,26,9): | 0.0000 | |
| Directional Movement: | 14.80273 | |
| AROON (14): | 100.00000 | |
| DEMA (21): | 0.12712 | |
| Parabolic SAR (0,02-0,02-0,2): | 0.12695 | |
| Elder Ray (13): | 0.00042 | |
| Super Trend (3,10): | 0.12696 | |
| Zig ZAG (10): | 0.12775 | |
| VORTEX (21): | 1.0886 | |
| Stochastique (14,3,5): | 90.92 | |
| TEMA (21): | 0.12725 | |
| Williams %R (14): | -5.66 | |
| Chande Momentum Oscillator (20): | 0.00090 | |
| Repulse (5,40,3): | 0.5368 | |
| ROCnROLL: | 1 | |
| TRIX (15,9): | -0.0223 | |
| Courbe Coppock: | 0.61 |
| MA7: | 0.12720 | |
| MA20: | 0.12706 | |
| MA50: | 0.12811 | |
| MA100: | 0.12707 | |
| MAexp7: | 0.12736 | |
| MAexp20: | 0.12724 | |
| MAexp50: | 0.12744 | |
| MAexp100: | 0.12739 | |
| Price / MA7: | +0.41% | |
| Price / MA20: | +0.52% | |
| Price / MA50: | -0.30% | |
| Price / MA100: | +0.51% | |
| Price / MAexp7: | +0.27% | |
| Price / MAexp20: | +0.37% | |
| Price / MAexp50: | +0.21% | |
| Price / MAexp100: | +0.25% |
About author
Online


Add a comment
Comments
0 comments on the analysis JPY/ZAR - 1H