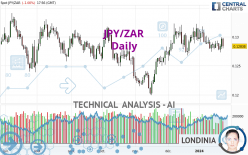
JPY/ZAR - Daily - Technical analysis published on 01/23/2024 (GMT)
- 92
- 0
- Timeframe : Daily
- - Analysis generated on
- Status : NEUTRAL

Summary of the analysis

Additional analysis
Quotes
JPY/ZAR rating 0.12839 ZAR. On the day, this instrument lost -1.00% and was between 0.12804 ZAR and 0.12986 ZAR. This implies that the price is at +0.27% from its lowest and at -1.13% from its highest.The Central Gaps scanner detects a bullish opening. A small advantage for buyers in the very short term.
Bullish opening
Type : Bullish
Timeframe : Openning
Here is a more detailed summary of the historical variations registered by JPY/ZAR:
Near a new HIGH record (1st january)
Type : Bullish
Timeframe : Weekly
Near a new HIGH record (1 month)
Type : Bullish
Timeframe : Weekly
Technical
Technical analysis of this Daily chart of JPY/ZAR indicates that the overall trend is slightly bullish. 57.14% of the signals given by moving averages are bullish. As the signals currently given by short-term moving averages are rather neutral, the overall trend could quickly return to neutral as well. The Central Indicators market scanner is currently detecting several bearish signals that could impact this trend:
Bearish price crossover with Moving Average 20
Type : Bearish
Timeframe : Daily
Bearish price crossover with adaptative moving average 20
Type : Bearish
Timeframe : Daily
Technical indicators are slightly bearish. There is therefore considerable uncertainty about the continuation of the decline.
Other results related to technical indicators were also found by the Central Indicators scanner:
Pivot points : price is under support 1
Type : Neutral
Timeframe : Daily
RSI indicator is back under 50
Type : Bearish
Timeframe : Daily
Momentum indicator is back under 0
Type : Bearish
Timeframe : Daily
Williams %R indicator is back under -50
Type : Bearish
Timeframe : Daily
The Central Patterns scanner, which studies chart patterns, resistances and supports, has identified these signals:
Near horizontal support
Type : Bullish
Timeframe : Daily
Support of triangle is broken
Type : Bearish
Timeframe : Daily
For a small setback in the very short term, the Central Candlesticks scanner currently notes the presence of this bearish pattern in Japanese candlesticks:
Bearish engulfing lines
Type : Bearish
Timeframe : Daily
| S3 | S2 | S1 | Price | R1 | R2 | R3 | |
|---|---|---|---|---|---|---|---|
| ProTrendLines | 0.12197 | 0.12458 | 0.12663 | 0.12839 | 0.13162 | 0.13380 | 0.13816 |
| Change (%) | -5.00% | -2.97% | -1.37% | - | +2.52% | +4.21% | +7.61% |
| Change | -0.00642 | -0.00381 | -0.00176 | - | +0.00323 | +0.00541 | +0.00977 |
| Level | Minor | Intermediate | Major | - | Intermediate | Minor | Minor |
To determine price objectives, it is also possible to use the pivot points. Here is the price position in relation to pivot points:
| Pivot points | S3 | S2 | S1 | PP | R1 | R2 | R3 |
|---|---|---|---|---|---|---|---|
| Standard | 0.12639 | 0.12716 | 0.12842 | 0.12919 | 0.13045 | 0.13122 | 0.13248 |
| Camarilla | 0.12912 | 0.12931 | 0.12949 | 0.12968 | 0.12987 | 0.13005 | 0.13024 |
| Woodie | 0.12664 | 0.12728 | 0.12867 | 0.12931 | 0.13070 | 0.13134 | 0.13273 |
| Fibonacci | 0.12716 | 0.12794 | 0.12842 | 0.12919 | 0.12997 | 0.13045 | 0.13122 |
| Pivot points | S3 | S2 | S1 | PP | R1 | R2 | R3 |
|---|---|---|---|---|---|---|---|
| Standard | 0.12536 | 0.12635 | 0.12738 | 0.12837 | 0.12940 | 0.13039 | 0.13142 |
| Camarilla | 0.12785 | 0.12803 | 0.12822 | 0.12840 | 0.12859 | 0.12877 | 0.12896 |
| Woodie | 0.12537 | 0.12636 | 0.12739 | 0.12838 | 0.12941 | 0.13040 | 0.13143 |
| Fibonacci | 0.12635 | 0.12713 | 0.12760 | 0.12837 | 0.12915 | 0.12962 | 0.13039 |
| Pivot points | S3 | S2 | S1 | PP | R1 | R2 | R3 |
|---|---|---|---|---|---|---|---|
| Standard | 0.11984 | 0.12286 | 0.12627 | 0.12929 | 0.13270 | 0.13572 | 0.13913 |
| Camarilla | 0.12792 | 0.12851 | 0.12910 | 0.12969 | 0.13028 | 0.13087 | 0.13146 |
| Woodie | 0.12005 | 0.12296 | 0.12648 | 0.12939 | 0.13291 | 0.13582 | 0.13934 |
| Fibonacci | 0.12286 | 0.12531 | 0.12683 | 0.12929 | 0.13174 | 0.13326 | 0.13572 |
Numerical data
The following is the status of technical indicators and moving averages registered at the time this technical analysis was created:
| RSI (14): | 48.09 | |
| MACD (12,26,9): | 0.0000 | |
| Directional Movement: | 4.10410 | |
| AROON (14): | -85.71429 | |
| DEMA (21): | 0.12899 | |
| Parabolic SAR (0,02-0,02-0,2): | 0.13071 | |
| Elder Ray (13): | 0.00015 | |
| Super Trend (3,10): | 0.12597 | |
| Zig ZAG (10): | 0.12835 | |
| VORTEX (21): | 1.0264 | |
| Stochastique (14,3,5): | 34.11 | |
| TEMA (21): | 0.12850 | |
| Williams %R (14): | -73.63 | |
| Chande Momentum Oscillator (20): | -0.00084 | |
| Repulse (5,40,3): | -0.3207 | |
| ROCnROLL: | -1 | |
| TRIX (15,9): | 0.0185 | |
| Courbe Coppock: | 2.20 |
| MA7: | 0.12859 | |
| MA20: | 0.12927 | |
| MA50: | 0.12793 | |
| MA100: | 0.12747 | |
| MAexp7: | 0.12869 | |
| MAexp20: | 0.12885 | |
| MAexp50: | 0.12834 | |
| MAexp100: | 0.12835 | |
| Price / MA7: | -0.16% | |
| Price / MA20: | -0.68% | |
| Price / MA50: | +0.36% | |
| Price / MA100: | +0.72% | |
| Price / MAexp7: | -0.24% | |
| Price / MAexp20: | -0.36% | |
| Price / MAexp50: | +0.03% | |
| Price / MAexp100: | +0.02% |
About author

Online


Add a comment
Comments
0 comments on the analysis JPY/ZAR - Daily