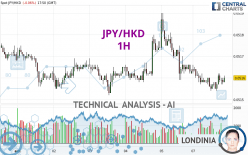
JPY/HKD - 1H - Technical analysis published on 04/08/2024 (GMT)
- 92
- 0
Click here for a new analysis!
- Timeframe : 1H
- - Analysis generated on
- Status : TARGET REACHED

Summary of the analysis

Additional analysis
Quotes
The JPY/HKD rating is 0.05160 HKD. The price is lower by -0.06% since the last closing and was between 0.05154 HKD and 0.05166 HKD. This implies that the price is at +0.12% from its lowest and at -0.12% from its highest.The Central Gaps scanner detects a bullish opening. A small advantage for buyers in the very short term.
Bullish opening
Type : Bullish
Timeframe : Openning
Here is a more detailed summary of the historical variations registered by JPY/HKD:
Near a new LOW record (5 years)
Type : Bearish
Timeframe : Weekly
Near a new LOW record (1 year)
Type : Bearish
Timeframe : Weekly
Near a new LOW record (1st january)
Type : Bearish
Timeframe : Weekly
Near a new HIGH record (1 month)
Type : Bullish
Timeframe : Weekly
Technical
Technical analysis of JPY/HKD in 1H shows an overall bearish trend. 71.43% of the signals given by moving averages are bearish. Caution: as the signals currently given by short-term moving averages are rather neutral, the bearish trend could slow down. The Central Indicators market scanner is currently detecting several bullish signals that could impact this trend:
Bullish price crossover with Moving Average 20
Type : Bullish
Timeframe : 1 hour
Bullish price crossover with adaptative moving average 20
Type : Bullish
Timeframe : 1 hour
In fact, 10 technical indicators on 18 studied are currently positioned bullish. Caution: the Central Indicators scanner currently detects an excess:
Williams %R indicator is overbought : over -20
Type : Neutral
Timeframe : 1 hour
RSI indicator is back over 50
Type : Bullish
Timeframe : 1 hour
Aroon indicator bullish trend
Type : Bullish
Timeframe : 1 hour
Central Patterns, the market scanner focusing on chart patterns, resistances and supports found these results:
Horizontal support is broken
Type : Bearish
Timeframe : 1 hour
Support of channel is broken
Type : Bearish
Timeframe : 1 hour
The Central Candlesticks scanner which studies Japanese candlesticks did not detect anything.
| S3 | S2 | S1 | Price | R1 | R2 | R3 | |
|---|---|---|---|---|---|---|---|
| ProTrendLines | 0.05148 | 0.05155 | 0.05159 | 0.05160 | 0.05165 | 0.05169 | 0.05178 |
| Change (%) | -0.23% | -0.10% | -0.02% | - | +0.10% | +0.17% | +0.35% |
| Change | -0.00012 | -0.00005 | -0.00001 | - | +0.00005 | +0.00009 | +0.00018 |
| Level | Minor | Major | Minor | - | Intermediate | Intermediate | Minor |
Pivot points can also be used to set your price objectives. Here is the price situation in relation to pivot points:
| Pivot points | S3 | S2 | S1 | PP | R1 | R2 | R3 |
|---|---|---|---|---|---|---|---|
| Standard | 0.05120 | 0.05140 | 0.05151 | 0.05171 | 0.05182 | 0.05202 | 0.05213 |
| Camarilla | 0.05155 | 0.05157 | 0.05160 | 0.05163 | 0.05166 | 0.05169 | 0.05172 |
| Woodie | 0.05117 | 0.05138 | 0.05148 | 0.05169 | 0.05179 | 0.05200 | 0.05210 |
| Fibonacci | 0.05140 | 0.05152 | 0.05159 | 0.05171 | 0.05183 | 0.05190 | 0.05202 |
| Pivot points | S3 | S2 | S1 | PP | R1 | R2 | R3 |
|---|---|---|---|---|---|---|---|
| Standard | 0.05109 | 0.05130 | 0.05147 | 0.05168 | 0.05185 | 0.05206 | 0.05223 |
| Camarilla | 0.05153 | 0.05156 | 0.05160 | 0.05163 | 0.05167 | 0.05170 | 0.05174 |
| Woodie | 0.05106 | 0.05129 | 0.05144 | 0.05167 | 0.05182 | 0.05205 | 0.05220 |
| Fibonacci | 0.05130 | 0.05145 | 0.05154 | 0.05168 | 0.05183 | 0.05192 | 0.05206 |
| Pivot points | S3 | S2 | S1 | PP | R1 | R2 | R3 |
|---|---|---|---|---|---|---|---|
| Standard | 0.04909 | 0.05028 | 0.05100 | 0.05219 | 0.05291 | 0.05410 | 0.05482 |
| Camarilla | 0.05119 | 0.05136 | 0.05154 | 0.05171 | 0.05189 | 0.05206 | 0.05224 |
| Woodie | 0.04885 | 0.05016 | 0.05076 | 0.05207 | 0.05267 | 0.05398 | 0.05458 |
| Fibonacci | 0.05028 | 0.05101 | 0.05146 | 0.05219 | 0.05292 | 0.05337 | 0.05410 |
Numerical data
The following are the details of the technical indicators and moving averages that were collected to generate this technical analysis:
| RSI (14): | 49.26 | |
| MACD (12,26,9): | 0.0000 | |
| Directional Movement: | -0.80267 | |
| AROON (14): | 35.71428 | |
| DEMA (21): | 0.05157 | |
| Parabolic SAR (0,02-0,02-0,2): | 0.05154 | |
| Elder Ray (13): | 0.00001 | |
| Super Trend (3,10): | 0.05165 | |
| Zig ZAG (10): | 0.05160 | |
| VORTEX (21): | 0.9365 | |
| Stochastique (14,3,5): | 62.50 | |
| TEMA (21): | 0.05157 | |
| Williams %R (14): | -12.50 | |
| Chande Momentum Oscillator (20): | 0.00003 | |
| Repulse (5,40,3): | 0.0685 | |
| ROCnROLL: | -1 | |
| TRIX (15,9): | -0.0067 | |
| Courbe Coppock: | 0.04 |
| MA7: | 0.05166 | |
| MA20: | 0.05194 | |
| MA50: | 0.05222 | |
| MA100: | 0.05291 | |
| MAexp7: | 0.05159 | |
| MAexp20: | 0.05159 | |
| MAexp50: | 0.05162 | |
| MAexp100: | 0.05164 | |
| Price / MA7: | -0.12% | |
| Price / MA20: | -0.65% | |
| Price / MA50: | -1.19% | |
| Price / MA100: | -2.48% | |
| Price / MAexp7: | +0.02% | |
| Price / MAexp20: | +0.02% | |
| Price / MAexp50: | -0.04% | |
| Price / MAexp100: | -0.08% |
About author
Online


Add a comment
Comments
0 comments on the analysis JPY/HKD - 1H