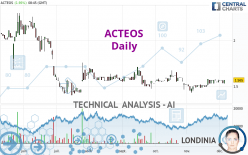
ACTEOS - Daily - Technical analysis published on 12/06/2022 (GMT)
- 111
- 0
Click here for a new analysis!
- Timeframe : Daily
- - Analysis generated on
- Status : INVALID

Summary of the analysis

Additional analysis
Quotes
The ACTEOS price is 1.565 EUR. The price registered an increase of +1.95% on the session with the lowest point at 1.530 EUR and the highest point at 1.565 EUR. The deviation from the price is +2.29% for the low point and 0% for the high point.A bearish opening was detected by the Central Gaps scanner. Sellers are trying to impose a bearish trend in the very short term.
Bearish opening
Type : Bearish
Timeframe : Openning
Here is a more detailed summary of the historical variations registered by ACTEOS:
Near a new HIGH record (1 month)
Type : Bullish
Timeframe : Weekly
Technical
Technical analysis of ACTEOS in Daily shows an overall slightly bullish trend. 57.14% of the signals given by moving averages are bullish. The overall trend could accelerate as strong bullish signals from short-term moving averages are expected. The Central Indicators market scanner is currently detecting several bullish signals that could impact this trend:
Bullish price crossover with Moving Average 50
Type : Bullish
Timeframe : Daily
Bullish price crossover with Moving Average 100
Type : Bullish
Timeframe : Daily
Bullish price crossover with adaptative moving average 20
Type : Bullish
Timeframe : Daily
An assessment of technical indicators shows a moderate bullish signal.
Caution: the Central Indicators scanner currently detects an excess:
Williams %R indicator is overbought : over -20
Type : Neutral
Timeframe : Daily
Pivot points : price is over resistance 1
Type : Neutral
Timeframe : Daily
RSI indicator is back over 50
Type : Bullish
Timeframe : Daily
Central Patterns, the market scanner focusing on chart patterns, resistances and supports found these results:
Near horizontal resistance
Type : Bearish
Timeframe : Daily
Near resistance of triangle
Type : Bearish
Timeframe : Daily
Resistance of channel is broken
Type : Bullish
Timeframe : Daily
For a small rebound in the very short term, the Central Candlesticks scanner currently notes the presence of this bullish pattern in Japanese candlesticks:
Bullish engulfing lines
Type : Bullish
Timeframe : Daily
| S3 | S2 | S1 | Price | R1 | R2 | R3 | |
|---|---|---|---|---|---|---|---|
| ProTrendLines | 1.242 | 1.400 | 1.554 | 1.565 | 1.706 | 2.002 | 2.269 |
| Change (%) | -20.64% | -10.54% | -0.70% | - | +9.01% | +27.92% | +44.98% |
| Change | -0.323 | -0.165 | -0.011 | - | +0.141 | +0.437 | +0.704 |
| Level | Major | Major | Major | - | Major | Minor | Intermediate |
Attention could also be paid to pivot points to set price objectives:
| Pivot points | S3 | S2 | S1 | PP | R1 | R2 | R3 |
|---|---|---|---|---|---|---|---|
| Standard | 1.487 | 1.508 | 1.522 | 1.543 | 1.557 | 1.578 | 1.592 |
| Camarilla | 1.525 | 1.529 | 1.532 | 1.535 | 1.538 | 1.541 | 1.545 |
| Woodie | 1.483 | 1.506 | 1.518 | 1.541 | 1.553 | 1.576 | 1.588 |
| Fibonacci | 1.508 | 1.522 | 1.530 | 1.543 | 1.557 | 1.565 | 1.578 |
| Pivot points | S3 | S2 | S1 | PP | R1 | R2 | R3 |
|---|---|---|---|---|---|---|---|
| Standard | 1.505 | 1.520 | 1.540 | 1.555 | 1.575 | 1.590 | 1.610 |
| Camarilla | 1.550 | 1.554 | 1.557 | 1.560 | 1.563 | 1.566 | 1.570 |
| Woodie | 1.508 | 1.521 | 1.543 | 1.556 | 1.578 | 1.591 | 1.613 |
| Fibonacci | 1.520 | 1.533 | 1.542 | 1.555 | 1.568 | 1.577 | 1.590 |
| Pivot points | S3 | S2 | S1 | PP | R1 | R2 | R3 |
|---|---|---|---|---|---|---|---|
| Standard | 1.315 | 1.370 | 1.465 | 1.520 | 1.615 | 1.670 | 1.765 |
| Camarilla | 1.519 | 1.533 | 1.546 | 1.560 | 1.574 | 1.588 | 1.601 |
| Woodie | 1.335 | 1.380 | 1.485 | 1.530 | 1.635 | 1.680 | 1.785 |
| Fibonacci | 1.370 | 1.427 | 1.463 | 1.520 | 1.577 | 1.613 | 1.670 |
Numerical data
The following are the details of the technical indicators and moving averages that were collected to generate this technical analysis:
| RSI (14): | 54.32 | |
| MACD (12,26,9): | 0.0070 | |
| Directional Movement: | -13.632 | |
| AROON (14): | 14.286 | |
| DEMA (21): | 1.550 | |
| Parabolic SAR (0,02-0,02-0,2): | 1.455 | |
| Elder Ray (13): | -0.002 | |
| Super Trend (3,10): | 1.492 | |
| Zig ZAG (10): | 1.565 | |
| VORTEX (21): | 1.1100 | |
| Stochastique (14,3,5): | 74.84 | |
| TEMA (21): | 1.562 | |
| Williams %R (14): | -11.77 | |
| Chande Momentum Oscillator (20): | 0.055 | |
| Repulse (5,40,3): | 2.0930 | |
| ROCnROLL: | 1 | |
| TRIX (15,9): | 0.0290 | |
| Courbe Coppock: | 6.57 |
| MA7: | 1.556 | |
| MA20: | 1.535 | |
| MA50: | 1.545 | |
| MA100: | 1.560 | |
| MAexp7: | 1.554 | |
| MAexp20: | 1.544 | |
| MAexp50: | 1.549 | |
| MAexp100: | 1.583 | |
| Price / MA7: | +0.58% | |
| Price / MA20: | +1.95% | |
| Price / MA50: | +1.29% | |
| Price / MA100: | +0.32% | |
| Price / MAexp7: | +0.71% | |
| Price / MAexp20: | +1.36% | |
| Price / MAexp50: | +1.03% | |
| Price / MAexp100: | -1.14% |
News
The last news published on ACTEOS at the time of the generation of this analysis was as follows:
About author
Online


Add a comment
Comments
0 comments on the analysis ACTEOS - Daily