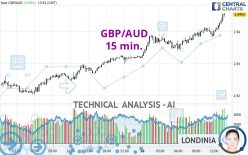
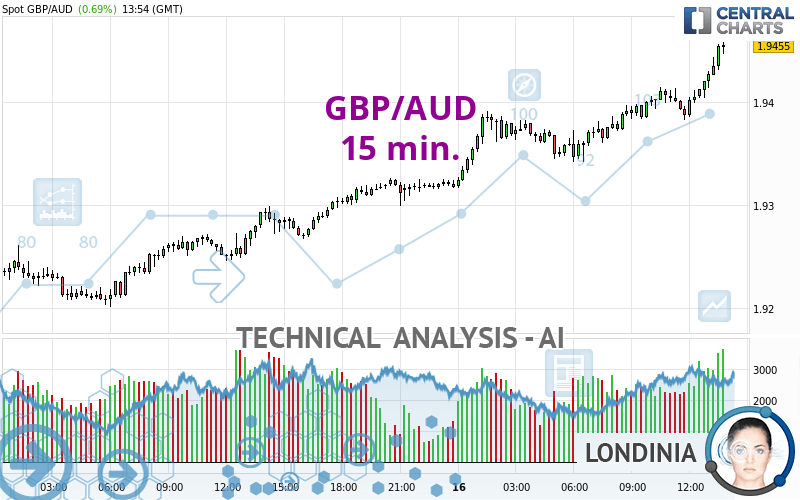
GBP/AUD - 15 min. - Technical analysis published on 04/16/2024 (GMT)
- 91
- 0
Click here for a new analysis!
- Timeframe : 15 min.
- - Analysis generated on
- Status : LEVEL MAINTAINED
Summary of the analysis

Additional analysis
Quotes
GBP/AUD rating 1.9455 AUD. The price registered an increase of +0.69% on the session and was between 1.9317 AUD and 1.9458 AUD. This implies that the price is at +0.71% from its lowest and at -0.02% from its highest.A study of price movements over other periods shows the following variations:
Near a new LOW record (1 year)
Type : Bearish
Timeframe : Weekly
Near a new LOW record (1st january)
Type : Bearish
Timeframe : Weekly
Near a new LOW record (1 month)
Type : Bearish
Timeframe : Weekly
Technical
A technical analysis in 15 min. of this GBP/AUD chart shows a strongly bullish trend. 92.86% of the signals given by moving averages are bullish. This strongly bullish trend is supported by the strong bullish signals given by short-term moving averages. The Central Indicators market scanner currently does not detect any result that concerns moving averages.
The probability of a further increase is high given the direction of the technical indicators.
Caution: the Central Indicators scanner currently detects an excess:
RSI indicator is overbought : over 70
Type : Neutral
Timeframe : 15 minutes
CCI indicator is overbought : over 100
Type : Neutral
Timeframe : 15 minutes
Williams %R indicator is overbought : over -20
Type : Neutral
Timeframe : 15 minutes
Pivot points : price is over resistance 2
Type : Neutral
Timeframe : 15 minutes
Pivot points : price is over resistance 2
Type : Neutral
Timeframe : Weekly
Central Patterns, the market scanner focusing on chart patterns, resistances and supports found these results:
Near horizontal support
Type : Bullish
Timeframe : 15 minutes
Support of channel is broken
Type : Bearish
Timeframe : 15 minutes
The Central Candlesticks scanner, specialised in Japanese candlesticks, did not identify any signals.
| S3 | S2 | S1 | Price | R1 | R2 | R3 | |
|---|---|---|---|---|---|---|---|
| ProTrendLines | 1.9238 | 1.9266 | 1.9281 | 1.9455 | 1.9533 | 1.9718 | 1.9897 |
| Change (%) | -1.12% | -0.97% | -0.89% | - | +0.40% | +1.35% | +2.27% |
| Change | -0.0217 | -0.0189 | -0.0174 | - | +0.0078 | +0.0263 | +0.0442 |
| Level | Minor | Intermediate | Minor | - | Intermediate | Minor | Major |
Attention could also be paid to pivot points to set price objectives:
| Pivot points | S3 | S2 | S1 | PP | R1 | R2 | R3 |
|---|---|---|---|---|---|---|---|
| Standard | 1.9114 | 1.9158 | 1.9239 | 1.9283 | 1.9364 | 1.9408 | 1.9489 |
| Camarilla | 1.9287 | 1.9298 | 1.9310 | 1.9321 | 1.9333 | 1.9344 | 1.9355 |
| Woodie | 1.9134 | 1.9167 | 1.9259 | 1.9292 | 1.9384 | 1.9417 | 1.9509 |
| Fibonacci | 1.9158 | 1.9205 | 1.9235 | 1.9283 | 1.9330 | 1.9360 | 1.9408 |
| Pivot points | S3 | S2 | S1 | PP | R1 | R2 | R3 |
|---|---|---|---|---|---|---|---|
| Standard | 1.8977 | 1.9046 | 1.9155 | 1.9224 | 1.9333 | 1.9402 | 1.9511 |
| Camarilla | 1.9216 | 1.9232 | 1.9249 | 1.9265 | 1.9281 | 1.9298 | 1.9314 |
| Woodie | 1.8998 | 1.9056 | 1.9176 | 1.9234 | 1.9354 | 1.9412 | 1.9532 |
| Fibonacci | 1.9046 | 1.9114 | 1.9156 | 1.9224 | 1.9292 | 1.9334 | 1.9402 |
| Pivot points | S3 | S2 | S1 | PP | R1 | R2 | R3 |
|---|---|---|---|---|---|---|---|
| Standard | 1.8905 | 1.9078 | 1.9224 | 1.9397 | 1.9543 | 1.9716 | 1.9862 |
| Camarilla | 1.9282 | 1.9312 | 1.9341 | 1.9370 | 1.9399 | 1.9429 | 1.9458 |
| Woodie | 1.8892 | 1.9071 | 1.9211 | 1.9390 | 1.9530 | 1.9709 | 1.9849 |
| Fibonacci | 1.9078 | 1.9200 | 1.9275 | 1.9397 | 1.9519 | 1.9594 | 1.9716 |
Numerical data
The following are the details of the technical indicators and moving averages that were collected to generate this technical analysis:
| RSI (14): | 73.66 | |
| MACD (12,26,9): | 0.0014 | |
| Directional Movement: | 24.7789 | |
| AROON (14): | 50.0000 | |
| DEMA (21): | 1.9425 | |
| Parabolic SAR (0,02-0,02-0,2): | 1.9395 | |
| Elder Ray (13): | 0.0027 | |
| Super Trend (3,10): | 1.9400 | |
| Zig ZAG (10): | 1.9450 | |
| VORTEX (21): | 1.2291 | |
| Stochastique (14,3,5): | 93.38 | |
| TEMA (21): | 1.9431 | |
| Williams %R (14): | -5.41 | |
| Chande Momentum Oscillator (20): | 0.0043 | |
| Repulse (5,40,3): | 0.1629 | |
| ROCnROLL: | 1 | |
| TRIX (15,9): | 0.0083 | |
| Courbe Coppock: | 0.26 |
| MA7: | 1.9256 | |
| MA20: | 1.9290 | |
| MA50: | 1.9343 | |
| MA100: | 1.9205 | |
| MAexp7: | 1.9427 | |
| MAexp20: | 1.9407 | |
| MAexp50: | 1.9383 | |
| MAexp100: | 1.9351 | |
| Price / MA7: | +1.03% | |
| Price / MA20: | +0.86% | |
| Price / MA50: | +0.58% | |
| Price / MA100: | +1.30% | |
| Price / MAexp7: | +0.14% | |
| Price / MAexp20: | +0.25% | |
| Price / MAexp50: | +0.37% | |
| Price / MAexp100: | +0.54% |
News
Don't forget to follow the news on GBP/AUD. At the time of publication of this analysis, the latest news was as follows:
-
 GBPAUD Clears 1.8500 Level
-
Pound Pairs Breaking Critical Levels From GBP/USD to GBP/AUD (Quick Take Video)
-
Volatility In Commodities GBP/AUD
-
Risk on pressures GBPAUD
-
Potential short-term upside for GBP/USD, GBP/AUD a longer-term play on sterling weakness
About author

Online


Add a comment
Comments
0 comments on the analysis GBP/AUD - 15 min.