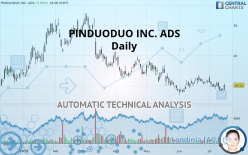
PDD HOLDINGS INC. ADS - Daily - Technical analysis published on 07/16/2019 (GMT)
- Who voted?
- 390
- 0
Click here for a new analysis!
- Timeframe : Daily
- - Analysis generated on
- Status : INVALID
Summary of the analysis

Additional analysis
Quotes
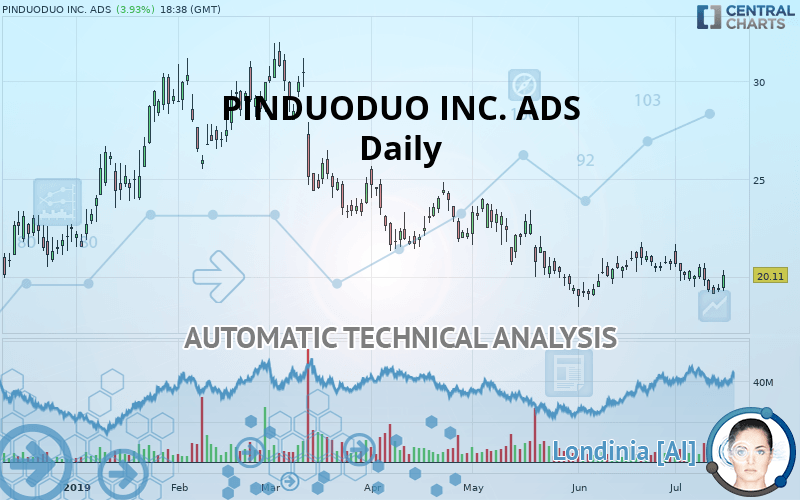
The PINDUODUO INC. ADS price is 20.11 USD. The price has increased by +3.93% since the last closing with the lowest point at 19.30 USD and the highest point at 20.37 USD. The deviation from the price is +4.20% for the low point and -1.28% for the high point.The Central Gaps scanner detects a bullish opening. A small advantage for buyers in the very short term.
Bullish opening
Type : Bullish
Timeframe : Openning
A study of price movements over other periods shows the following variations:
Near a new LOW record (1st january)
Type : Bearish
Timeframe : Weekly
Near a new LOW record (1 month)
Type : Bearish
Timeframe : Weekly
Technical
Technical analysis of PINDUODUO INC. ADS in Daily shows a overall strongly bearish trend. 92.86% of the signals given by moving averages are bearish. The overall trend is supported by the strong bearish signals from short-term moving averages. There is no crossing of moving average by the price or crossing of moving averages between themselves.
An assessment of technical indicators does not currently provide any relevant information to suggest whether the signal given by the technical indicators is more bullish or bearish.
Caution: the Central Indicators scanner currently detects an excess:
CCI indicator is oversold : under -100
Type : Neutral
Timeframe : Daily
Previous candle closed under Bollinger bands
Type : Neutral
Timeframe : Daily
Williams %R indicator is oversold : under -80
Type : Neutral
Timeframe : Daily
Pivot points : price is over resistance 3
Type : Neutral
Timeframe : Daily
Ichimoku - Bearish crossover : Tenkan & Kijun
Type : Bearish
Timeframe : Daily
Price is back under the pivot point
Type : Bearish
Timeframe : Daily
Price is back under the pivot point
Type : Bearish
Timeframe : Weekly
Central Patterns, the market scanner focusing on chart patterns, resistances and supports found these results:
Near support of triangle
Type : Bullish
Timeframe : Daily
Support of channel is broken
Type : Bearish
Timeframe : Daily
The Central Candlesticks scanner, specialised in Japanese candlesticks, did not identify any signals.
| S2 | S1 | Price | R1 | R2 | R3 | |
|---|---|---|---|---|---|---|
| ProTrendLines | 17.18 | 19.03 | 20.11 | 21.08 | 24.41 | 25.93 |
| Change (%) | -14.57% | -5.37% | - | +4.82% | +21.38% | +28.94% |
| Change | -2.93 | -1.08 | - | +0.97 | +4.30 | +5.82 |
| Level | Intermediate | Major | - | Major | Minor | Minor |
Pivot points can also be used to set your price objectives. Here is the price situation in relation to pivot points:
| Pivot points | S3 | S2 | S1 | PP | R1 | R2 | R3 |
|---|---|---|---|---|---|---|---|
| Standard | 18.76 | 19.00 | 19.17 | 19.41 | 19.58 | 19.82 | 19.99 |
| Camarilla | 19.24 | 19.28 | 19.31 | 19.35 | 19.39 | 19.43 | 19.46 |
| Woodie | 18.74 | 18.98 | 19.15 | 19.39 | 19.56 | 19.80 | 19.97 |
| Fibonacci | 19.00 | 19.15 | 19.25 | 19.41 | 19.56 | 19.66 | 19.82 |
| Pivot points | S3 | S2 | S1 | PP | R1 | R2 | R3 |
|---|---|---|---|---|---|---|---|
| Standard | 17.02 | 18.06 | 18.60 | 19.65 | 20.19 | 21.23 | 21.77 |
| Camarilla | 18.70 | 18.85 | 19.00 | 19.14 | 19.29 | 19.43 | 19.58 |
| Woodie | 16.76 | 17.93 | 18.35 | 19.52 | 19.93 | 21.10 | 21.52 |
| Fibonacci | 18.06 | 18.67 | 19.04 | 19.65 | 20.25 | 20.63 | 21.23 |
| Pivot points | S3 | S2 | S1 | PP | R1 | R2 | R3 |
|---|---|---|---|---|---|---|---|
| Standard | 15.48 | 16.97 | 18.80 | 20.29 | 22.12 | 23.61 | 25.44 |
| Camarilla | 19.72 | 20.02 | 20.33 | 20.63 | 20.93 | 21.24 | 21.54 |
| Woodie | 15.65 | 17.06 | 18.97 | 20.38 | 22.29 | 23.70 | 25.61 |
| Fibonacci | 16.97 | 18.24 | 19.02 | 20.29 | 21.56 | 22.34 | 23.61 |
Numerical data
The following is the status of the technical indicators and moving averages at the time of publication of this technical analysis:
| RSI (14): | 47.56 | |
| MACD (12,26,9): | -0.3100 | |
| Directional Movement: | 2.24 | |
| AROON (14): | -57.14 | |
| DEMA (21): | 19.73 | |
| Parabolic SAR (0,02-0,02-0,2): | 20.95 | |
| Elder Ray (13): | -0.13 | |
| Super Trend (3,10): | 21.54 | |
| Zig ZAG (10): | 20.10 | |
| VORTEX (21): | 0.9100 | |
| Stochastique (14,3,5): | 15.61 | |
| TEMA (21): | 19.75 | |
| Williams %R (14): | -63.97 | |
| Chande Momentum Oscillator (20): | -0.72 | |
| Repulse (5,40,3): | 0.6800 | |
| ROCnROLL: | -1 | |
| TRIX (15,9): | -0.1500 | |
| Courbe Coppock: | 9.50 |
| MA7: | 19.75 | |
| MA20: | 20.33 | |
| MA50: | 20.68 | |
| MA100: | 22.86 | |
| MAexp7: | 19.78 | |
| MAexp20: | 20.12 | |
| MAexp50: | 20.87 | |
| MAexp100: | 21.95 | |
| Price / MA7: | +1.82% | |
| Price / MA20: | -1.08% | |
| Price / MA50: | -2.76% | |
| Price / MA100: | -12.03% | |
| Price / MAexp7: | +1.67% | |
| Price / MAexp20: | -0.05% | |
| Price / MAexp50: | -3.64% | |
| Price / MAexp100: | -8.38% |
News
The last news published on PINDUODUO INC. ADS at the time of the generation of this analysis was as follows:
- Pinduoduo Announces First Quarter 2019 Unaudited Financial Results
- Pinduoduo to Report First Quarter 2019 Unaudited Financial Results on May 20, 2019
- Pinduoduo Files Annual Report on Form 20-F for Fiscal Year 2018
- Pinduoduo Announces Fourth Quarter and Fiscal Year 2018 Results
- Pinduoduo to Report Fourth Quarter and Fiscal Year 2018 Unaudited Financial Results on March 13, 2019
About author

Online


Add a comment
Comments
0 comments on the analysis PDD HOLDINGS INC. ADS - Daily