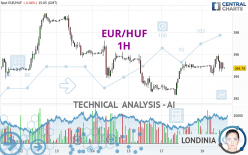
EUR/HUF - 1H - Technical analysis published on 03/19/2024 (GMT)
- 99
- 0
- Timeframe : 1H
- - Analysis generated on
- Status : NEUTRAL

Summary of the analysis

Additional analysis
Quotes
The EUR/HUF price is 394.73 HUF. The price registered a decrease of -0.04% on the session and was between 394.08 HUF and 396.02 HUF. This implies that the price is at +0.16% from its lowest and at -0.33% from its highest.The Central Gaps scanner detects a bullish opening marking the presence of buyers ahead of sellers at the opening but not sufficiently marked to allow the price to register a quotation gap.
Bullish opening
Type : Bullish
Timeframe : Openning
So that you have an overall view of the price change, here is a table showing the variations over several periods:
Near a new HIGH record (1 year)
Type : Bullish
Timeframe : Weekly
Near a new LOW record (1st january)
Type : Bearish
Timeframe : Weekly
Near a new LOW record (1 month)
Type : Bearish
Timeframe : Weekly
Technical
A technical analysis in 1H of this EUR/HUF chart shows a slightly bearish trend. 50.00% of the signals given by moving averages are bearish. As the signals currently given by short-term moving averages are rather neutral, the slightly bearish trend could return to neutral. The Central Indicators market scanner is currently detecting several bearish signals that could impact this trend:
Bearish price crossover with Moving Average 20
Type : Bearish
Timeframe : 1 hour
Bearish price crossover with Moving Average 100
Type : Bearish
Timeframe : 1 hour
Bearish price crossover with adaptative moving average 20
Type : Bearish
Timeframe : 1 hour
In fact, only 7 technical indicators out of 18 studied are currently positioned bearish. Central Indicators, the detector scanner for these technical indicators has recently detected several signals:
RSI indicator is back under 50
Type : Bearish
Timeframe : 1 hour
Price is back over the pivot point
Type : Bullish
Timeframe : Weekly
Momentum indicator is back under 0
Type : Bearish
Timeframe : 1 hour
Williams %R indicator is back under -50
Type : Bearish
Timeframe : 1 hour
An analysis of the price chart with the Central Patterns scanner (detector of chart patterns and resistances and supports) shows several results that can have an impact on the price change:
Near horizontal support
Type : Bullish
Timeframe : 1 hour
Support of channel is broken
Type : Bearish
Timeframe : 1 hour
The presence of a bearish pattern in Japanese candlesticks detected by Central Candlesticks that could cause a correction in the very short term was also detected:
Bearish harami
Type : Bearish
Timeframe : 1 hour
| S3 | S2 | S1 | Price | R1 | R2 | R3 | |
|---|---|---|---|---|---|---|---|
| ProTrendLines | 393.20 | 393.82 | 394.65 | 394.73 | 395.86 | 397.25 | 399.08 |
| Change (%) | -0.39% | -0.23% | -0.02% | - | +0.29% | +0.64% | +1.10% |
| Change | -1.53 | -0.91 | -0.08 | - | +1.13 | +2.52 | +4.35 |
| Level | Major | Intermediate | Minor | - | Intermediate | Minor | Major |
To determine price objectives, it is also possible to use the pivot points. Here is the price position in relation to pivot points:
| Pivot points | S3 | S2 | S1 | PP | R1 | R2 | R3 |
|---|---|---|---|---|---|---|---|
| Standard | 389.92 | 391.10 | 392.99 | 394.17 | 396.06 | 397.24 | 399.13 |
| Camarilla | 394.04 | 394.32 | 394.60 | 394.88 | 395.16 | 395.44 | 395.72 |
| Woodie | 390.28 | 391.28 | 393.35 | 394.35 | 396.42 | 397.42 | 399.49 |
| Fibonacci | 391.10 | 392.27 | 393.00 | 394.17 | 395.34 | 396.07 | 397.24 |
| Pivot points | S3 | S2 | S1 | PP | R1 | R2 | R3 |
|---|---|---|---|---|---|---|---|
| Standard | 383.20 | 387.88 | 390.40 | 395.08 | 397.60 | 402.28 | 404.80 |
| Camarilla | 390.94 | 391.60 | 392.26 | 392.92 | 393.58 | 394.24 | 394.90 |
| Woodie | 382.12 | 387.34 | 389.32 | 394.54 | 396.52 | 401.74 | 403.72 |
| Fibonacci | 387.88 | 390.63 | 392.33 | 395.08 | 397.83 | 399.53 | 402.28 |
| Pivot points | S3 | S2 | S1 | PP | R1 | R2 | R3 |
|---|---|---|---|---|---|---|---|
| Standard | 372.81 | 377.57 | 385.14 | 389.90 | 397.47 | 402.23 | 409.80 |
| Camarilla | 389.32 | 390.45 | 391.58 | 392.71 | 393.84 | 394.97 | 396.10 |
| Woodie | 374.22 | 378.27 | 386.55 | 390.60 | 398.88 | 402.93 | 411.21 |
| Fibonacci | 377.57 | 382.28 | 385.19 | 389.90 | 394.61 | 397.52 | 402.23 |
Numerical data
The following is the status of the technical indicators and moving averages at the time of publication of this technical analysis:
| RSI (14): | 49.16 | |
| MACD (12,26,9): | 0.1900 | |
| Directional Movement: | 0.21 | |
| AROON (14): | 21.43 | |
| DEMA (21): | 395.18 | |
| Parabolic SAR (0,02-0,02-0,2): | 394.42 | |
| Elder Ray (13): | -0.04 | |
| Super Trend (3,10): | 394.27 | |
| Zig ZAG (10): | 394.72 | |
| VORTEX (21): | 1.0000 | |
| Stochastique (14,3,5): | 43.81 | |
| TEMA (21): | 395.23 | |
| Williams %R (14): | -61.34 | |
| Chande Momentum Oscillator (20): | -0.08 | |
| Repulse (5,40,3): | -0.0300 | |
| ROCnROLL: | -1 | |
| TRIX (15,9): | 0.0100 | |
| Courbe Coppock: | 0.10 |
| MA7: | 395.42 | |
| MA20: | 393.29 | |
| MA50: | 388.33 | |
| MA100: | 384.35 | |
| MAexp7: | 395.04 | |
| MAexp20: | 394.90 | |
| MAexp50: | 394.69 | |
| MAexp100: | 394.85 | |
| Price / MA7: | -0.17% | |
| Price / MA20: | +0.37% | |
| Price / MA50: | +1.65% | |
| Price / MA100: | +2.70% | |
| Price / MAexp7: | -0.08% | |
| Price / MAexp20: | -0.04% | |
| Price / MAexp50: | +0.01% | |
| Price / MAexp100: | -0.03% |
About author
Online


Add a comment
Comments
0 comments on the analysis EUR/HUF - 1H