EUR/CAD - 1H - Technical analysis published on 04/26/2024 (GMT)
- 76
- 0
Click here for a new analysis!
- Timeframe : 1H
- - Analysis generated on
- Status : LEVEL MAINTAINED
Summary of the analysis

Additional analysis
Quotes
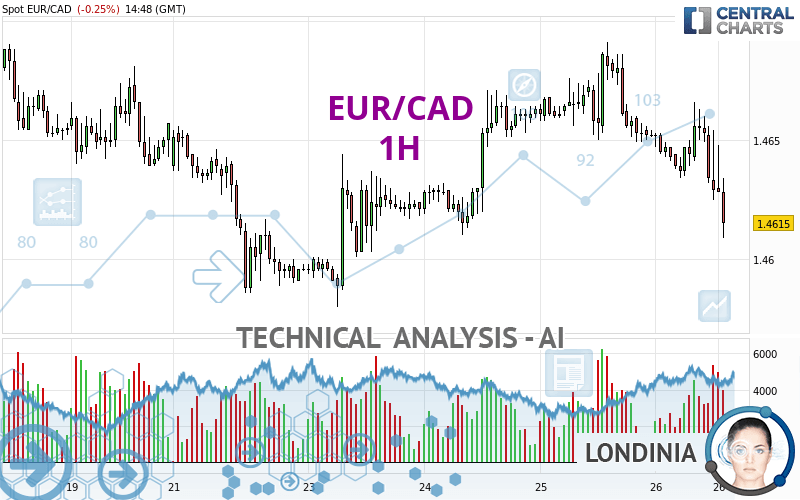
The EUR/CAD rating is 1.4616 CAD. The price is lower by -0.25% since the last closing and was traded between 1.4609 CAD and 1.4666 CAD over the period. The price is currently at +0.05% from its lowest and -0.34% from its highest.So that you have an overall view of the price change, here is a table showing the variations over several periods:
Near a new LOW record (1 year)
Type : Bearish
Timeframe : Weekly
Near a new HIGH record (1st january)
Type : Bullish
Timeframe : Weekly
Near a new HIGH record (1 month)
Type : Bullish
Timeframe : Weekly
Technical
A technical analysis in 1H of this EUR/CAD chart shows a sharp bearish trend. The signals given by moving averages are 82.14% bearish. This strong bearish trend is confirmed by the strong signals currently being given by short-term moving averages. The Central Indicators market scanner is currently detecting several bearish and bullish signals that could impact this trend:
Bearish trend reversal : Moving Average 50
Type : Bearish
Timeframe : 1 hour
Bullish trend reversal : Moving Average 100
Type : Bullish
Timeframe : 1 hour
An assessment of technical indicators shows a bearish signal.
Caution: the Central Indicators scanner currently detects an excess:
RSI indicator is oversold : under 30
Type : Neutral
Timeframe : 1 hour
CCI indicator is oversold : under -100
Type : Neutral
Timeframe : 1 hour
Williams %R indicator is oversold : under -80
Type : Neutral
Timeframe : 1 hour
Pivot points : price is under support 3
Type : Neutral
Timeframe : 1 hour
The Central Patterns scanner, which studies chart patterns, resistances and supports, has identified these signals:
Near horizontal support
Type : Bullish
Timeframe : 1 hour
Support of channel is broken
Type : Bearish
Timeframe : 1 hour
The Central Candlesticks scanner, specialised in Japanese candlesticks, did not identify any signals.
| S3 | S2 | S1 | Price | R1 | R2 | R3 | |
|---|---|---|---|---|---|---|---|
| ProTrendLines | 1.4495 | 1.4580 | 1.4610 | 1.4616 | 1.4624 | 1.4650 | 1.4691 |
| Change (%) | -0.83% | -0.25% | -0.04% | - | +0.05% | +0.23% | +0.51% |
| Change | -0.0121 | -0.0036 | -0.0006 | - | +0.0008 | +0.0034 | +0.0075 |
| Level | Minor | Intermediate | Minor | - | Major | Major | Intermediate |
Attention could also be paid to pivot points to set price objectives:
| Pivot points | S3 | S2 | S1 | PP | R1 | R2 | R3 |
|---|---|---|---|---|---|---|---|
| Standard | 1.4595 | 1.4622 | 1.4637 | 1.4664 | 1.4679 | 1.4706 | 1.4721 |
| Camarilla | 1.4641 | 1.4644 | 1.4648 | 1.4652 | 1.4656 | 1.4660 | 1.4664 |
| Woodie | 1.4589 | 1.4619 | 1.4631 | 1.4661 | 1.4673 | 1.4703 | 1.4715 |
| Fibonacci | 1.4622 | 1.4638 | 1.4648 | 1.4664 | 1.4680 | 1.4690 | 1.4706 |
| Pivot points | S3 | S2 | S1 | PP | R1 | R2 | R3 |
|---|---|---|---|---|---|---|---|
| Standard | 1.4486 | 1.4549 | 1.4603 | 1.4666 | 1.4720 | 1.4783 | 1.4837 |
| Camarilla | 1.4625 | 1.4636 | 1.4646 | 1.4657 | 1.4668 | 1.4679 | 1.4689 |
| Woodie | 1.4482 | 1.4547 | 1.4599 | 1.4664 | 1.4716 | 1.4781 | 1.4833 |
| Fibonacci | 1.4549 | 1.4594 | 1.4621 | 1.4666 | 1.4711 | 1.4738 | 1.4783 |
| Pivot points | S3 | S2 | S1 | PP | R1 | R2 | R3 |
|---|---|---|---|---|---|---|---|
| Standard | 1.4345 | 1.4465 | 1.4540 | 1.4660 | 1.4735 | 1.4855 | 1.4930 |
| Camarilla | 1.4561 | 1.4579 | 1.4597 | 1.4615 | 1.4633 | 1.4651 | 1.4669 |
| Woodie | 1.4323 | 1.4454 | 1.4518 | 1.4649 | 1.4713 | 1.4844 | 1.4908 |
| Fibonacci | 1.4465 | 1.4540 | 1.4586 | 1.4660 | 1.4735 | 1.4781 | 1.4855 |
Numerical data
The following is the status of the technical indicators and moving averages at the time of publication of this technical analysis:
| RSI (14): | 27.68 | |
| MACD (12,26,9): | -0.0008 | |
| Directional Movement: | -17.3969 | |
| AROON (14): | -42.8571 | |
| DEMA (21): | 1.4634 | |
| Parabolic SAR (0,02-0,02-0,2): | 1.4662 | |
| Elder Ray (13): | -0.0018 | |
| Super Trend (3,10): | 1.4667 | |
| Zig ZAG (10): | 1.4611 | |
| VORTEX (21): | 0.8031 | |
| Stochastique (14,3,5): | 8.03 | |
| TEMA (21): | 1.4627 | |
| Williams %R (14): | -91.23 | |
| Chande Momentum Oscillator (20): | -0.0035 | |
| Repulse (5,40,3): | -0.2998 | |
| ROCnROLL: | 2 | |
| TRIX (15,9): | -0.0048 | |
| Courbe Coppock: | 0.23 |
| MA7: | 1.4637 | |
| MA20: | 1.4662 | |
| MA50: | 1.4679 | |
| MA100: | 1.4643 | |
| MAexp7: | 1.4632 | |
| MAexp20: | 1.4643 | |
| MAexp50: | 1.4647 | |
| MAexp100: | 1.4645 | |
| Price / MA7: | -0.14% | |
| Price / MA20: | -0.31% | |
| Price / MA50: | -0.43% | |
| Price / MA100: | -0.18% | |
| Price / MAexp7: | -0.11% | |
| Price / MAexp20: | -0.18% | |
| Price / MAexp50: | -0.21% | |
| Price / MAexp100: | -0.20% |
News
Don't forget to follow the news on EUR/CAD. At the time of publication of this analysis, the latest news was as follows:
-
 Forex Analysis: EUR/USD, GBP/USD, EUR/CAD - Amana Capital
-
Why I'm looking to sell EURCAD: Coleman
-
EUR/CAD To Hold Steady
-
EUR/CAD Bullish Breakthrough
-
Bullish Divergence – EURCAD
About author

Online


Add a comment
Comments
0 comments on the analysis EUR/CAD - 1H