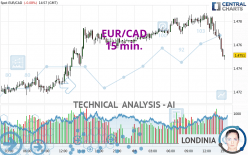
EUR/CAD - 15 min. - Technical analysis published on 05/08/2024 (GMT)
- 82
- 0
Click here for a new analysis!
- Timeframe : 15 min.
- - Analysis generated on
- Status : LEVEL MAINTAINED

Summary of the analysis

Additional analysis
Quotes
EUR/CAD rating 1.4751 CAD. The price registered a decrease of -0.08% on the session and was between 1.4747 CAD and 1.4787 CAD. This implies that the price is at +0.03% from its lowest and at -0.24% from its highest.A study of price movements over other periods shows the following variations:
Near a new LOW record (1 year)
Type : Bearish
Timeframe : Weekly
New HIGH record (1st january)
Type : Bullish
Timeframe : Weekly
New HIGH record (1 month)
Type : Bullish
Timeframe : Weekly
Technical
Technical analysis of this 15 min. chart of EUR/CAD indicates that the overall trend is slightly bearish. Only 60.71% of the signals given by moving averages are bearish. This slightly bearish trend is reinforced by the strong signals currently being given by short-term moving averages. The Central Indicators market scanner is currently detecting several bearish signals that could impact this trend:
Bearish trend reversal : adaptative moving average 100
Type : Bearish
Timeframe : 15 minutes
Moving Average bearish crossovers : AMA20 & AMA50
Type : Bearish
Timeframe : 15 minutes
An assessment of technical indicators does not currently provide any relevant information to suggest whether the signal given by the technical indicators is more bullish or bearish.
But beware of excesses. The Central Indicators scanner currently detects this:
RSI indicator is oversold : under 30
Type : Neutral
Timeframe : 15 minutes
CCI indicator is oversold : under -100
Type : Neutral
Timeframe : 15 minutes
CCI indicator: bullish divergence
Type : Bullish
Timeframe : 15 minutes
Williams %R indicator is oversold : under -80
Type : Neutral
Timeframe : 15 minutes
Central Patterns, the market scanner focusing on chart patterns, resistances and supports found these results:
Near horizontal support
Type : Bullish
Timeframe : 15 minutes
Support of channel is broken
Type : Bearish
Timeframe : 15 minutes
The Central Candlesticks scanner which studies Japanese candlesticks did not detect anything.
| S3 | S2 | S1 | Price | R1 | R2 | R3 | |
|---|---|---|---|---|---|---|---|
| ProTrendLines | 1.4641 | 1.4676 | 1.4739 | 1.4751 | 1.4775 | 1.4908 | 1.5074 |
| Change (%) | -0.75% | -0.51% | -0.08% | - | +0.16% | +1.06% | +2.19% |
| Change | -0.0110 | -0.0075 | -0.0012 | - | +0.0024 | +0.0157 | +0.0323 |
| Level | Minor | Minor | Major | - | Intermediate | Minor | Major |
Attention could also be paid to pivot points to set price objectives:
| Pivot points | S3 | S2 | S1 | PP | R1 | R2 | R3 |
|---|---|---|---|---|---|---|---|
| Standard | 1.4670 | 1.4694 | 1.4728 | 1.4752 | 1.4786 | 1.4810 | 1.4844 |
| Camarilla | 1.4747 | 1.4752 | 1.4758 | 1.4763 | 1.4768 | 1.4774 | 1.4779 |
| Woodie | 1.4676 | 1.4697 | 1.4734 | 1.4755 | 1.4792 | 1.4813 | 1.4850 |
| Fibonacci | 1.4694 | 1.4716 | 1.4730 | 1.4752 | 1.4774 | 1.4788 | 1.4810 |
| Pivot points | S3 | S2 | S1 | PP | R1 | R2 | R3 |
|---|---|---|---|---|---|---|---|
| Standard | 1.4501 | 1.4554 | 1.4641 | 1.4694 | 1.4781 | 1.4834 | 1.4921 |
| Camarilla | 1.4691 | 1.4703 | 1.4716 | 1.4729 | 1.4742 | 1.4755 | 1.4768 |
| Woodie | 1.4519 | 1.4563 | 1.4659 | 1.4703 | 1.4799 | 1.4843 | 1.4939 |
| Fibonacci | 1.4554 | 1.4607 | 1.4640 | 1.4694 | 1.4747 | 1.4780 | 1.4834 |
| Pivot points | S3 | S2 | S1 | PP | R1 | R2 | R3 |
|---|---|---|---|---|---|---|---|
| Standard | 1.4355 | 1.4450 | 1.4573 | 1.4668 | 1.4791 | 1.4886 | 1.5009 |
| Camarilla | 1.4635 | 1.4655 | 1.4675 | 1.4695 | 1.4715 | 1.4735 | 1.4755 |
| Woodie | 1.4368 | 1.4457 | 1.4586 | 1.4675 | 1.4804 | 1.4893 | 1.5022 |
| Fibonacci | 1.4450 | 1.4534 | 1.4585 | 1.4668 | 1.4752 | 1.4803 | 1.4886 |
Numerical data
The following is the status of the technical indicators and moving averages at the time of publication of this technical analysis:
| RSI (14): | 29.01 | |
| MACD (12,26,9): | -0.0003 | |
| Directional Movement: | -16.3267 | |
| AROON (14): | -85.7143 | |
| DEMA (21): | 1.4770 | |
| Parabolic SAR (0,02-0,02-0,2): | 1.4778 | |
| Elder Ray (13): | -0.0013 | |
| Super Trend (3,10): | 1.4780 | |
| Zig ZAG (10): | 1.4756 | |
| VORTEX (21): | 0.8252 | |
| Stochastique (14,3,5): | 7.61 | |
| TEMA (21): | 1.4765 | |
| Williams %R (14): | -97.06 | |
| Chande Momentum Oscillator (20): | -0.0031 | |
| Repulse (5,40,3): | -0.1123 | |
| ROCnROLL: | 2 | |
| TRIX (15,9): | -0.0006 | |
| Courbe Coppock: | 0.19 |
| MA7: | 1.4719 | |
| MA20: | 1.4675 | |
| MA50: | 1.4692 | |
| MA100: | 1.4648 | |
| MAexp7: | 1.4763 | |
| MAexp20: | 1.4774 | |
| MAexp50: | 1.4773 | |
| MAexp100: | 1.4766 | |
| Price / MA7: | +0.22% | |
| Price / MA20: | +0.52% | |
| Price / MA50: | +0.40% | |
| Price / MA100: | +0.70% | |
| Price / MAexp7: | -0.08% | |
| Price / MAexp20: | -0.16% | |
| Price / MAexp50: | -0.15% | |
| Price / MAexp100: | -0.10% |
News
The latest news and videos published on EUR/CAD at the time of the analysis were as follows:
-
 Forex Analysis: EUR/USD, GBP/USD, EUR/CAD - Amana Capital
-
Why I'm looking to sell EURCAD: Coleman
-
EUR/CAD To Hold Steady
-
EUR/CAD Bullish Breakthrough
-
Bullish Divergence – EURCAD
About author

Online


Add a comment
Comments
0 comments on the analysis EUR/CAD - 15 min.