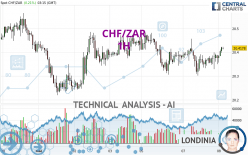
CHF/ZAR - 1H - Technical analysis published on 05/08/2024 (GMT)
- 95
- 0
Click here for a new analysis!
- Timeframe : 1H
- - Analysis generated on
- Status : TARGET REACHED

Summary of the analysis

Additional analysis
Quotes
CHF/ZAR rating 20.4178 ZAR. On the day, this instrument gained +0.21% and was traded between 20.3569 ZAR and 20.4228 ZAR over the period. The price is currently at +0.30% from its lowest and -0.02% from its highest.The Central Gaps scanner detects a bearish opening marking the presence of sellers ahead of buyers at the opening but not sufficiently marked to allow the price to register a quotation gap.
Bearish opening
Type : Bearish
Timeframe : Openning
So that you have an overall view of the price change, here is a table showing the variations over several periods:
Near a new LOW record (1 year)
Type : Bearish
Timeframe : Weekly
Near a new LOW record (1st january)
Type : Bearish
Timeframe : Weekly
Near a new LOW record (1 month)
Type : Bearish
Timeframe : Weekly
Technical
Technical analysis of this 1H chart of CHF/ZAR indicates that the overall trend is bullish. 64.29% of the signals given by moving averages are bullish. This bullish trend is supported by the strong bullish signals given by short-term moving averages. The Central Indicators scanner detects bullish signals on moving averages that could impact this trend:
Bullish trend reversal : Moving Average 20
Type : Bullish
Timeframe : 1 hour
Bullish trend reversal : adaptative moving average 100
Type : Bullish
Timeframe : 1 hour
Technical indicators are strongly bullish, suggesting that the price increase should continue.
But beware of excesses. The Central Indicators scanner currently detects this:
CCI indicator is overbought : over 100
Type : Neutral
Timeframe : 1 hour
Williams %R indicator is overbought : over -20
Type : Neutral
Timeframe : 1 hour
Price is back under the pivot point
Type : Bearish
Timeframe : Weekly
Central Patterns, the market scanner focusing on chart patterns, resistances and supports found these results:
Near resistance of channel
Type : Bearish
Timeframe : 1 hour
Near resistance of triangle
Type : Bearish
Timeframe : 1 hour
The Central Candlesticks scanner which studies Japanese candlesticks did not detect anything.
| S3 | S2 | S1 | Price | R1 | R2 | R3 | |
|---|---|---|---|---|---|---|---|
| ProTrendLines | 19.3389 | 20.2195 | 20.3256 | 20.4178 | 20.4963 | 20.5911 | 20.9205 |
| Change (%) | -5.28% | -0.97% | -0.45% | - | +0.38% | +0.85% | +2.46% |
| Change | -1.0789 | -0.1983 | -0.0922 | - | +0.0785 | +0.1733 | +0.5027 |
| Level | Minor | Minor | Major | - | Major | Major | Minor |
To determine price objectives, it is also possible to use the pivot points. Here is the price position in relation to pivot points:
| Pivot points | S3 | S2 | S1 | PP | R1 | R2 | R3 |
|---|---|---|---|---|---|---|---|
| Standard | 20.1436 | 20.2223 | 20.2991 | 20.3778 | 20.4546 | 20.5333 | 20.6101 |
| Camarilla | 20.3330 | 20.3473 | 20.3616 | 20.3758 | 20.3901 | 20.4043 | 20.4186 |
| Woodie | 20.1426 | 20.2218 | 20.2981 | 20.3773 | 20.4536 | 20.5328 | 20.6091 |
| Fibonacci | 20.2223 | 20.2817 | 20.3184 | 20.3778 | 20.4372 | 20.4739 | 20.5333 |
| Pivot points | S3 | S2 | S1 | PP | R1 | R2 | R3 |
|---|---|---|---|---|---|---|---|
| Standard | 19.8198 | 20.0196 | 20.2259 | 20.4257 | 20.6320 | 20.8318 | 21.0381 |
| Camarilla | 20.3204 | 20.3577 | 20.3949 | 20.4321 | 20.4693 | 20.5066 | 20.5438 |
| Woodie | 19.8230 | 20.0212 | 20.2291 | 20.4273 | 20.6352 | 20.8334 | 21.0413 |
| Fibonacci | 20.0196 | 20.1748 | 20.2706 | 20.4257 | 20.5809 | 20.6767 | 20.8318 |
| Pivot points | S3 | S2 | S1 | PP | R1 | R2 | R3 |
|---|---|---|---|---|---|---|---|
| Standard | 18.9850 | 19.6916 | 20.0628 | 20.7694 | 21.1406 | 21.8472 | 22.2184 |
| Camarilla | 20.1377 | 20.2365 | 20.3353 | 20.4341 | 20.5329 | 20.6317 | 20.7305 |
| Woodie | 18.8174 | 19.6078 | 19.8952 | 20.6856 | 20.9730 | 21.7634 | 22.0508 |
| Fibonacci | 19.6916 | 20.1033 | 20.3577 | 20.7694 | 21.1811 | 21.4355 | 21.8472 |
Numerical data
The following is the status of the technical indicators and moving averages at the time of publication of this technical analysis:
| RSI (14): | 61.02 | |
| MACD (12,26,9): | 0.0070 | |
| Directional Movement: | 1.7763 | |
| AROON (14): | 35.7142 | |
| DEMA (21): | 20.3907 | |
| Parabolic SAR (0,02-0,02-0,2): | 20.3309 | |
| Elder Ray (13): | 0.0274 | |
| Super Trend (3,10): | 20.4515 | |
| Zig ZAG (10): | 20.4180 | |
| VORTEX (21): | 1.0143 | |
| Stochastique (14,3,5): | 95.39 | |
| TEMA (21): | 20.4019 | |
| Williams %R (14): | -4.07 | |
| Chande Momentum Oscillator (20): | 0.0555 | |
| Repulse (5,40,3): | 0.2212 | |
| ROCnROLL: | 1 | |
| TRIX (15,9): | -0.0003 | |
| Courbe Coppock: | 0.37 |
| MA7: | 20.3834 | |
| MA20: | 20.6635 | |
| MA50: | 20.9162 | |
| MA100: | 21.3419 | |
| MAexp7: | 20.3998 | |
| MAexp20: | 20.3849 | |
| MAexp50: | 20.3855 | |
| MAexp100: | 20.4066 | |
| Price / MA7: | +0.17% | |
| Price / MA20: | -1.19% | |
| Price / MA50: | -2.38% | |
| Price / MA100: | -4.33% | |
| Price / MAexp7: | +0.09% | |
| Price / MAexp20: | +0.16% | |
| Price / MAexp50: | +0.16% | |
| Price / MAexp100: | +0.05% |
About author
Online


Add a comment
Comments
0 comments on the analysis CHF/ZAR - 1H