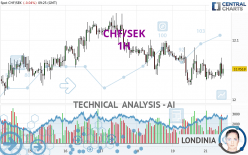
CHF/SEK - 1H - Technical analysis published on 01/22/2024 (GMT)
- 102
- 0
Click here for a new analysis!
- Timeframe : 1H
- - Analysis generated on
- Status : TARGET REACHED

Summary of the analysis

Additional analysis
Quotes
The CHF/SEK price is 12.0518 SEK. The price registered a decrease of -0.04% on the session with the lowest point at 12.0325 SEK and the highest point at 12.0703 SEK. The deviation from the price is +0.16% for the low point and -0.15% for the high point.The Central Gaps scanner detects a bullish opening marking the presence of buyers ahead of sellers at the opening but not sufficiently marked to allow the price to register a quotation gap.
Bullish opening
Type : Bullish
Timeframe : Openning
Here is a more detailed summary of the historical variations registered by CHF/SEK:
Near a new HIGH record (5 years)
Type : Bullish
Timeframe : Weekly
Near a new HIGH record (1 year)
Type : Bullish
Timeframe : Weekly
Near a new LOW record (1st january)
Type : Bearish
Timeframe : Weekly
Near a new LOW record (1 month)
Type : Bearish
Timeframe : Weekly
Technical
Technical analysis of this 1H chart of CHF/SEK indicates that the overall trend is bearish. The signals given by moving averages are 78.57% bearish. This bearish trend could slow down given the neutral signals currently being given by short-term moving averages. The Central Indicators scanner detects bullish and bearish signals on moving averages that could impact this trend:
Bearish trend reversal : Moving Average 20
Type : Bearish
Timeframe : 1 hour
Bullish price crossover with Moving Average 20
Type : Bullish
Timeframe : 1 hour
In fact, 10 technical indicators on 18 studied are currently bullish. Central Indicators, the scanner specialised in technical indicators, has identified these signals:
Price is back over the pivot point
Type : Bullish
Timeframe : 1 hour
Momentum indicator is back over 0
Type : Bullish
Timeframe : 1 hour
Central Patterns, the market scanner focusing on chart patterns, resistances and supports found these results:
Near horizontal support
Type : Bullish
Timeframe : 1 hour
Near support of triangle
Type : Bullish
Timeframe : 1 hour
The Central Candlesticks scanner, specialised in Japanese candlesticks, did not identify any signals.
| S3 | S2 | S1 | Price | R1 | R2 | R3 | |
|---|---|---|---|---|---|---|---|
| ProTrendLines | 11.9779 | 12.0073 | 12.0251 | 12.0518 | 12.0536 | 12.0879 | 12.1110 |
| Change (%) | -0.61% | -0.37% | -0.22% | - | +0.01% | +0.30% | +0.49% |
| Change | -0.0739 | -0.0445 | -0.0267 | - | +0.0018 | +0.0361 | +0.0592 |
| Level | Minor | Minor | Major | - | Minor | Intermediate | Intermediate |
Attention could also be paid to pivot points to set price objectives:
| Pivot points | S3 | S2 | S1 | PP | R1 | R2 | R3 |
|---|---|---|---|---|---|---|---|
| Standard | 11.9606 | 11.9923 | 12.0243 | 12.0560 | 12.0880 | 12.1197 | 12.1517 |
| Camarilla | 12.0387 | 12.0445 | 12.0504 | 12.0562 | 12.0620 | 12.0679 | 12.0737 |
| Woodie | 11.9607 | 11.9924 | 12.0244 | 12.0561 | 12.0881 | 12.1198 | 12.1518 |
| Fibonacci | 11.9923 | 12.0167 | 12.0317 | 12.0560 | 12.0804 | 12.0954 | 12.1197 |
| Pivot points | S3 | S2 | S1 | PP | R1 | R2 | R3 |
|---|---|---|---|---|---|---|---|
| Standard | 11.8831 | 11.9533 | 12.0048 | 12.0750 | 12.1265 | 12.1967 | 12.2482 |
| Camarilla | 12.0227 | 12.0339 | 12.0450 | 12.0562 | 12.0674 | 12.0785 | 12.0897 |
| Woodie | 11.8737 | 11.9486 | 11.9954 | 12.0703 | 12.1171 | 12.1920 | 12.2388 |
| Fibonacci | 11.9533 | 11.9998 | 12.0285 | 12.0750 | 12.1215 | 12.1502 | 12.1967 |
| Pivot points | S3 | S2 | S1 | PP | R1 | R2 | R3 |
|---|---|---|---|---|---|---|---|
| Standard | 11.4167 | 11.5389 | 11.7631 | 11.8853 | 12.1095 | 12.2317 | 12.4559 |
| Camarilla | 11.8919 | 11.9237 | 11.9555 | 11.9872 | 12.0190 | 12.0507 | 12.0825 |
| Woodie | 11.4676 | 11.5644 | 11.8140 | 11.9108 | 12.1604 | 12.2572 | 12.5068 |
| Fibonacci | 11.5389 | 11.6713 | 11.7530 | 11.8853 | 12.0177 | 12.0994 | 12.2317 |
Numerical data
The following is the status of the technical indicators and moving averages at the time of publication of this technical analysis:
| RSI (14): | 49.15 | |
| MACD (12,26,9): | -0.0037 | |
| Directional Movement: | 9.0854 | |
| AROON (14): | 71.4285 | |
| DEMA (21): | 12.0426 | |
| Parabolic SAR (0,02-0,02-0,2): | 12.0333 | |
| Elder Ray (13): | -0.0018 | |
| Super Trend (3,10): | 12.0767 | |
| Zig ZAG (10): | 12.0545 | |
| VORTEX (21): | 1.0398 | |
| Stochastique (14,3,5): | 56.15 | |
| TEMA (21): | 12.0459 | |
| Williams %R (14): | -51.06 | |
| Chande Momentum Oscillator (20): | 0.0152 | |
| Repulse (5,40,3): | 0.0276 | |
| ROCnROLL: | -1 | |
| TRIX (15,9): | -0.0061 | |
| Courbe Coppock: | 0.09 |
| MA7: | 12.0715 | |
| MA20: | 11.9929 | |
| MA50: | 11.9263 | |
| MA100: | 12.0902 | |
| MAexp7: | 12.0467 | |
| MAexp20: | 12.0486 | |
| MAexp50: | 12.0584 | |
| MAexp100: | 12.0656 | |
| Price / MA7: | -0.16% | |
| Price / MA20: | +0.49% | |
| Price / MA50: | +1.05% | |
| Price / MA100: | -0.32% | |
| Price / MAexp7: | +0.04% | |
| Price / MAexp20: | +0.03% | |
| Price / MAexp50: | -0.05% | |
| Price / MAexp100: | -0.11% |
About author
Online


Add a comment
Comments
0 comments on the analysis CHF/SEK - 1H