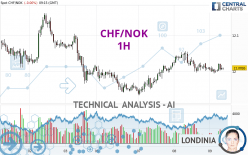
CHF/NOK - 1H - Technical analysis published on 05/09/2024 (GMT)
- 96
- 0
- Timeframe : 1H
- - Analysis generated on
- Status : NEUTRAL

Summary of the analysis

Additional analysis
Quotes
The CHF/NOK rating is 12.0095 NOK. On the day, this instrument gained +0.00% and was traded between 11.9943 NOK and 12.0218 NOK over the period. The price is currently at +0.13% from its lowest and -0.10% from its highest.The Central Gaps scanner detects a bullish opening marking the presence of buyers ahead of sellers at the opening but not sufficiently marked to allow the price to register a quotation gap.
Bullish opening
Type : Bullish
Timeframe : Openning
So that you have an overall view of the price change, here is a table showing the variations over several periods:
Near a new HIGH record (5 years)
Type : Bullish
Timeframe : Weekly
Near a new HIGH record (1 year)
Type : Bullish
Timeframe : Weekly
Near a new HIGH record (1st january)
Type : Bullish
Timeframe : Weekly
Near a new HIGH record (1 month)
Type : Bullish
Timeframe : Weekly
Technical
Technical analysis of CHF/NOK in 1H shows a neutral overall trend. This indecision is confirmed by the neutral signals currently being given by short-term moving averages. The Central Indicators scanner detects a bullish signal on moving averages that could impact this trend:
Bullish price crossover with Moving Average 20
Type : Bullish
Timeframe : 1 hour
In fact, only 7 technical indicators out of 18 studied are currently positioned bearish. Central Indicators, the detector scanner for these technical indicators has recently detected several signals:
Momentum indicator is back over 0
Type : Bullish
Timeframe : 1 hour
Williams %R indicator is back over -50
Type : Bullish
Timeframe : 1 hour
An analysis of the price chart with the Central Patterns scanner (detector of chart patterns and resistances and supports) shows several results that can have an impact on the price change:
Near horizontal support
Type : Bullish
Timeframe : 1 hour
Support of channel is broken
Type : Bearish
Timeframe : 1 hour
For a small setback in the very short term, the Central Candlesticks scanner currently notes the presence of this bearish pattern in Japanese candlesticks:
Bearish harami
Type : Bearish
Timeframe : 1 hour
| S3 | S2 | S1 | Price | R1 | R2 | R3 | |
|---|---|---|---|---|---|---|---|
| ProTrendLines | 11.7958 | 11.9241 | 11.9657 | 12.0095 | 12.0101 | 12.0567 | 12.1222 |
| Change (%) | -1.78% | -0.71% | -0.36% | - | +0.00% | +0.39% | +0.94% |
| Change | -0.2137 | -0.0854 | -0.0438 | - | +0.0006 | +0.0472 | +0.1127 |
| Level | Minor | Major | Minor | - | Minor | Intermediate | Major |
To determine price objectives, it is also possible to use the pivot points. Here is the price position in relation to pivot points:
| Pivot points | S3 | S2 | S1 | PP | R1 | R2 | R3 |
|---|---|---|---|---|---|---|---|
| Standard | 11.9266 | 11.9618 | 11.9857 | 12.0209 | 12.0448 | 12.0800 | 12.1039 |
| Camarilla | 11.9935 | 11.9989 | 12.0043 | 12.0097 | 12.0151 | 12.0205 | 12.0260 |
| Woodie | 11.9211 | 11.9590 | 11.9802 | 12.0181 | 12.0393 | 12.0772 | 12.0984 |
| Fibonacci | 11.9618 | 11.9843 | 11.9983 | 12.0209 | 12.0434 | 12.0574 | 12.0800 |
| Pivot points | S3 | S2 | S1 | PP | R1 | R2 | R3 |
|---|---|---|---|---|---|---|---|
| Standard | 11.7367 | 11.8512 | 11.9334 | 12.0479 | 12.1301 | 12.2446 | 12.3268 |
| Camarilla | 11.9615 | 11.9795 | 11.9976 | 12.0156 | 12.0336 | 12.0517 | 12.0697 |
| Woodie | 11.7206 | 11.8431 | 11.9173 | 12.0398 | 12.1140 | 12.2365 | 12.3107 |
| Fibonacci | 11.8512 | 11.9263 | 11.9728 | 12.0479 | 12.1230 | 12.1695 | 12.2446 |
| Pivot points | S3 | S2 | S1 | PP | R1 | R2 | R3 |
|---|---|---|---|---|---|---|---|
| Standard | 11.2641 | 11.5156 | 11.8024 | 12.0539 | 12.3407 | 12.5922 | 12.8790 |
| Camarilla | 11.9411 | 11.9904 | 12.0398 | 12.0891 | 12.1384 | 12.1878 | 12.2371 |
| Woodie | 11.2817 | 11.5244 | 11.8200 | 12.0627 | 12.3583 | 12.6010 | 12.8966 |
| Fibonacci | 11.5156 | 11.7213 | 11.8483 | 12.0539 | 12.2596 | 12.3866 | 12.5922 |
Numerical data
The following are the details of the technical indicators and moving averages that were collected to generate this technical analysis:
| RSI (14): | 49.41 | |
| MACD (12,26,9): | -0.0017 | |
| Directional Movement: | 2.6919 | |
| AROON (14): | -42.8572 | |
| DEMA (21): | 12.0075 | |
| Parabolic SAR (0,02-0,02-0,2): | 11.9959 | |
| Elder Ray (13): | 0.0001 | |
| Super Trend (3,10): | 12.0410 | |
| Zig ZAG (10): | 12.0057 | |
| VORTEX (21): | 0.9265 | |
| Stochastique (14,3,5): | 41.38 | |
| TEMA (21): | 12.0022 | |
| Williams %R (14): | -62.93 | |
| Chande Momentum Oscillator (20): | -0.0024 | |
| Repulse (5,40,3): | -0.0179 | |
| ROCnROLL: | 2 | |
| TRIX (15,9): | -0.0027 | |
| Courbe Coppock: | 0.09 |
| MA7: | 12.0142 | |
| MA20: | 12.0319 | |
| MA50: | 11.9706 | |
| MA100: | 12.0186 | |
| MAexp7: | 12.0078 | |
| MAexp20: | 12.0094 | |
| MAexp50: | 12.0084 | |
| MAexp100: | 12.0110 | |
| Price / MA7: | -0.04% | |
| Price / MA20: | -0.19% | |
| Price / MA50: | +0.32% | |
| Price / MA100: | -0.08% | |
| Price / MAexp7: | +0.01% | |
| Price / MAexp20: | +0.00% | |
| Price / MAexp50: | +0.01% | |
| Price / MAexp100: | -0.01% |
About author
Online


Add a comment
Comments
0 comments on the analysis CHF/NOK - 1H