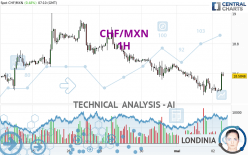
CHF/MXN - 1H - Technical analysis published on 05/02/2024 (GMT)
- 82
- 0
Click here for a new analysis!
- Timeframe : 1H
- - Analysis generated on
- Status : TARGET REACHED

Summary of the analysis

Additional analysis
Quotes
The CHF/MXN price is 18.5856 MXN. On the day, this instrument gained +0.48% with the lowest point at 18.4754 MXN and the highest point at 18.6113 MXN. The deviation from the price is +0.60% for the low point and -0.14% for the high point.Here is a more detailed summary of the historical variations registered by CHF/MXN:
Near a new LOW record (5 years)
Type : Bearish
Timeframe : Weekly
Near a new LOW record (1 year)
Type : Bearish
Timeframe : Weekly
Near a new LOW record (1st january)
Type : Bearish
Timeframe : Weekly
Near a new LOW record (1 month)
Type : Bearish
Timeframe : Weekly
Technical
Technical analysis of CHF/MXN in 1H shows an overall slightly bearish trend. Only 57.14% of the signals given by moving averages are bearish. This slightly bearish trend could quickly be reversed due to the strong bullish signals currently being given by short-term moving averages. The Central Indicators scanner detects bullish signals on moving averages that could impact this trend:
Bullish trend reversal : Moving Average 20
Type : Bullish
Timeframe : 1 hour
Bullish trend reversal : adaptative moving average 20
Type : Bullish
Timeframe : 1 hour
Bullish trend reversal : adaptative moving average 50
Type : Bullish
Timeframe : 1 hour
An assessment of technical indicators shows a strong bullish signal.
But beware of excesses. The Central Indicators scanner currently detects this:
CCI indicator is overbought : over 100
Type : Neutral
Timeframe : 1 hour
Williams %R indicator is overbought : over -20
Type : Neutral
Timeframe : 1 hour
RSI indicator is back over 50
Type : Bullish
Timeframe : 1 hour
Parabolic SAR indicator bullish reversal
Type : Bullish
Timeframe : 1 hour
SuperTrend indicator bullish reversal
Type : Bullish
Timeframe : 1 hour
Price is back under the pivot point
Type : Bearish
Timeframe : Weekly
Momentum indicator is back over 0
Type : Bullish
Timeframe : 1 hour
An analysis of the price chart with the Central Patterns scanner (detector of chart patterns and resistances and supports) shows a result that can have an impact on the price change:
Near horizontal support
Type : Bullish
Timeframe : 1 hour
The Central Candlesticks scanner, specialised in Japanese candlesticks, did not identify any signals.
| S3 | S2 | S1 | Price | R1 | R2 | R3 | |
|---|---|---|---|---|---|---|---|
| ProTrendLines | 18.0333 | 18.3835 | 18.4893 | 18.5856 | 18.6057 | 18.6482 | 18.7567 |
| Change (%) | -2.97% | -1.09% | -0.52% | - | +0.11% | +0.34% | +0.92% |
| Change | -0.5523 | -0.2021 | -0.0963 | - | +0.0201 | +0.0626 | +0.1711 |
| Level | Major | Minor | Intermediate | - | Minor | Intermediate | Minor |
To determine price objectives, it is also possible to use the pivot points. Here is the price position in relation to pivot points:
| Pivot points | S3 | S2 | S1 | PP | R1 | R2 | R3 |
|---|---|---|---|---|---|---|---|
| Standard | 18.2127 | 18.3343 | 18.4156 | 18.5372 | 18.6185 | 18.7401 | 18.8214 |
| Camarilla | 18.4411 | 18.4597 | 18.4783 | 18.4969 | 18.5155 | 18.5341 | 18.5527 |
| Woodie | 18.1926 | 18.3242 | 18.3955 | 18.5271 | 18.5984 | 18.7300 | 18.8013 |
| Fibonacci | 18.3343 | 18.4118 | 18.4597 | 18.5372 | 18.6147 | 18.6626 | 18.7401 |
| Pivot points | S3 | S2 | S1 | PP | R1 | R2 | R3 |
|---|---|---|---|---|---|---|---|
| Standard | 17.9871 | 18.2382 | 18.5029 | 18.7540 | 19.0187 | 19.2698 | 19.5345 |
| Camarilla | 18.6258 | 18.6730 | 18.7203 | 18.7676 | 18.8149 | 18.8622 | 18.9095 |
| Woodie | 17.9939 | 18.2416 | 18.5097 | 18.7574 | 19.0255 | 19.2732 | 19.5413 |
| Fibonacci | 18.2382 | 18.4352 | 18.5570 | 18.7540 | 18.9510 | 19.0728 | 19.2698 |
| Pivot points | S3 | S2 | S1 | PP | R1 | R2 | R3 |
|---|---|---|---|---|---|---|---|
| Standard | 15.8492 | 16.9105 | 17.7803 | 18.8416 | 19.7114 | 20.7727 | 21.6425 |
| Camarilla | 18.1192 | 18.2962 | 18.4732 | 18.6502 | 18.8272 | 19.0042 | 19.1813 |
| Woodie | 15.7536 | 16.8626 | 17.6847 | 18.7937 | 19.6158 | 20.7248 | 21.5469 |
| Fibonacci | 16.9105 | 17.6482 | 18.1039 | 18.8416 | 19.5793 | 20.0350 | 20.7727 |
Numerical data
The following are the details of the technical indicators and moving averages that were collected to generate this technical analysis:
| RSI (14): | 59.71 | |
| MACD (12,26,9): | -0.0124 | |
| Directional Movement: | 9.7115 | |
| AROON (14): | 85.7142 | |
| DEMA (21): | 18.5143 | |
| Parabolic SAR (0,02-0,02-0,2): | 18.4781 | |
| Elder Ray (13): | 0.0670 | |
| Super Trend (3,10): | 18.4771 | |
| Zig ZAG (10): | 18.6034 | |
| VORTEX (21): | 1.0310 | |
| Stochastique (14,3,5): | 74.22 | |
| TEMA (21): | 18.5293 | |
| Williams %R (14): | -4.63 | |
| Chande Momentum Oscillator (20): | 0.0868 | |
| Repulse (5,40,3): | 0.5058 | |
| ROCnROLL: | 1 | |
| TRIX (15,9): | -0.0204 | |
| Courbe Coppock: | 0.04 |
| MA7: | 18.6739 | |
| MA20: | 18.4990 | |
| MA50: | 18.7326 | |
| MA100: | 19.2518 | |
| MAexp7: | 18.5385 | |
| MAexp20: | 18.5367 | |
| MAexp50: | 18.5810 | |
| MAexp100: | 18.6354 | |
| Price / MA7: | -0.47% | |
| Price / MA20: | +0.47% | |
| Price / MA50: | -0.78% | |
| Price / MA100: | -3.46% | |
| Price / MAexp7: | +0.25% | |
| Price / MAexp20: | +0.26% | |
| Price / MAexp50: | +0.02% | |
| Price / MAexp100: | -0.27% |
About author
Online


Add a comment
Comments
0 comments on the analysis CHF/MXN - 1H