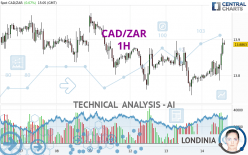
CAD/ZAR - 1H - Technical analysis published on 03/14/2024 (GMT)
- 91
- 0
Click here for a new analysis!
- Timeframe : 1H
- - Analysis generated on
- Status : INVALID

Summary of the analysis

Additional analysis
Quotes
The CAD/ZAR price is 13.8861 ZAR. On the day, this instrument gained +0.67% and was traded between 13.7837 ZAR and 13.9041 ZAR over the period. The price is currently at +0.74% from its lowest and -0.13% from its highest.A bullish opening was detected by the Central Gaps scanner. Buyers are trying to impose a bullish momentum in the very short term.
Bullish opening
Type : Bullish
Timeframe : Openning
Here is a more detailed summary of the historical variations registered by CAD/ZAR:
Near a new HIGH record (5 years)
Type : Bullish
Timeframe : Weekly
Near a new HIGH record (1st january)
Type : Bullish
Timeframe : Weekly
Near a new HIGH record (1 month)
Type : Bullish
Timeframe : Weekly
Technical
A technical analysis in 1H of this CAD/ZAR chart shows a bullish trend. 71.43% of the signals given by moving averages are bullish. This bullish trend is supported by the strong bullish signals given by short-term moving averages. The Central Indicators market scanner is currently detecting a bullish signal that could impact this trend:
Bullish trend reversal : Moving Average 100
Type : Bullish
Timeframe : 1 hour
The probability of a further increase is high given the direction of the technical indicators.
But beware of excesses. The Central Indicators scanner currently detects this:
CCI indicator is overbought : over 100
Type : Neutral
Timeframe : 1 hour
Previous candle closed over Bollinger bands
Type : Neutral
Timeframe : 1 hour
Williams %R indicator is overbought : over -20
Type : Neutral
Timeframe : 1 hour
Pivot points : price is over resistance 1
Type : Neutral
Timeframe : 1 hour
An analysis of the price chart with the Central Patterns scanner (detector of chart patterns and resistances and supports) shows several results that can have an impact on the price change:
Near horizontal resistance
Type : Bearish
Timeframe : 1 hour
Near resistance of channel
Type : Bearish
Timeframe : 1 hour
The Central Candlesticks scanner, specialised in Japanese candlesticks, did not identify any signals.
| S3 | S2 | S1 | Price | R1 | R2 | R3 | |
|---|---|---|---|---|---|---|---|
| ProTrendLines | 13.7764 | 13.8355 | 13.8802 | 13.8861 | 13.9920 | 14.0452 | 14.2462 |
| Change (%) | -0.79% | -0.36% | -0.04% | - | +0.76% | +1.15% | +2.59% |
| Change | -0.1097 | -0.0506 | -0.0059 | - | +0.1059 | +0.1591 | +0.3601 |
| Level | Intermediate | Minor | Major | - | Intermediate | Minor | Major |
Pivot points can also be used to set your price objectives. Here is the price situation in relation to pivot points:
| Pivot points | S3 | S2 | S1 | PP | R1 | R2 | R3 |
|---|---|---|---|---|---|---|---|
| Standard | 13.5744 | 13.6593 | 13.7265 | 13.8114 | 13.8786 | 13.9635 | 14.0307 |
| Camarilla | 13.7520 | 13.7659 | 13.7799 | 13.7938 | 13.8077 | 13.8217 | 13.8356 |
| Woodie | 13.5657 | 13.6549 | 13.7178 | 13.8070 | 13.8699 | 13.9591 | 14.0220 |
| Fibonacci | 13.6593 | 13.7174 | 13.7533 | 13.8114 | 13.8695 | 13.9054 | 13.9635 |
| Pivot points | S3 | S2 | S1 | PP | R1 | R2 | R3 |
|---|---|---|---|---|---|---|---|
| Standard | 13.4940 | 13.6649 | 13.7739 | 13.9448 | 14.0538 | 14.2247 | 14.3337 |
| Camarilla | 13.8059 | 13.8316 | 13.8572 | 13.8829 | 13.9086 | 13.9342 | 13.9599 |
| Woodie | 13.4631 | 13.6494 | 13.7430 | 13.9293 | 14.0229 | 14.2092 | 14.3028 |
| Fibonacci | 13.6649 | 13.7718 | 13.8379 | 13.9448 | 14.0517 | 14.1178 | 14.2247 |
| Pivot points | S3 | S2 | S1 | PP | R1 | R2 | R3 |
|---|---|---|---|---|---|---|---|
| Standard | 13.3498 | 13.6018 | 13.8755 | 14.1275 | 14.4012 | 14.6532 | 14.9269 |
| Camarilla | 14.0046 | 14.0528 | 14.1010 | 14.1492 | 14.1974 | 14.2456 | 14.2938 |
| Woodie | 13.3607 | 13.6072 | 13.8864 | 14.1329 | 14.4121 | 14.6586 | 14.9378 |
| Fibonacci | 13.6018 | 13.8026 | 13.9267 | 14.1275 | 14.3283 | 14.4524 | 14.6532 |
Numerical data
The following is the status of the technical indicators and moving averages at the time of publication of this technical analysis:
| RSI (14): | 66.99 | |
| MACD (12,26,9): | 0.0086 | |
| Directional Movement: | 10.7265 | |
| AROON (14): | 100.0000 | |
| DEMA (21): | 13.8309 | |
| Parabolic SAR (0,02-0,02-0,2): | 13.7851 | |
| Elder Ray (13): | 0.0407 | |
| Super Trend (3,10): | 13.7744 | |
| Zig ZAG (10): | 13.8808 | |
| VORTEX (21): | 1.2161 | |
| Stochastique (14,3,5): | 82.75 | |
| TEMA (21): | 13.8444 | |
| Williams %R (14): | -6.21 | |
| Chande Momentum Oscillator (20): | 0.0843 | |
| Repulse (5,40,3): | 0.5578 | |
| ROCnROLL: | 1 | |
| TRIX (15,9): | -0.0003 | |
| Courbe Coppock: | 0.66 |
| MA7: | 13.8672 | |
| MA20: | 14.0232 | |
| MA50: | 14.0260 | |
| MA100: | 13.8670 | |
| MAexp7: | 13.8439 | |
| MAexp20: | 13.8235 | |
| MAexp50: | 13.8265 | |
| MAexp100: | 13.8504 | |
| Price / MA7: | +0.14% | |
| Price / MA20: | -0.98% | |
| Price / MA50: | -1.00% | |
| Price / MA100: | +0.14% | |
| Price / MAexp7: | +0.31% | |
| Price / MAexp20: | +0.45% | |
| Price / MAexp50: | +0.43% | |
| Price / MAexp100: | +0.26% |
About author
Online


Add a comment
Comments
0 comments on the analysis CAD/ZAR - 1H