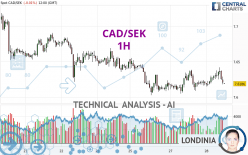
CAD/SEK - 1H - Technical analysis published on 02/28/2024 (GMT)
- 95
- 0
Click here for a new analysis!
- Timeframe : 1H
- - Analysis generated on
- Status : TARGET REACHED

Summary of the analysis

Additional analysis
Quotes
The CAD/SEK rating is 7.6186 SEK. On the day, this instrument lost -0.01% and was traded between 7.6148 SEK and 7.6418 SEK over the period. The price is currently at +0.05% from its lowest and -0.30% from its highest.The Central Gaps scanner detects a bullish opening marking the presence of buyers ahead of sellers at the opening but not sufficiently marked to allow the price to register a quotation gap.
Bullish opening
Type : Bullish
Timeframe : Openning
Here is a more detailed summary of the historical variations registered by CAD/SEK:
Near a new LOW record (1 year)
Type : Bearish
Timeframe : Weekly
Near a new HIGH record (1st january)
Type : Bullish
Timeframe : Weekly
Near a new HIGH record (1 month)
Type : Bullish
Timeframe : Weekly
Technical
Technical analysis of CAD/SEK in 1H shows an overall bearish trend. 78.57% of the signals given by moving averages are bearish. This bearish trend is slowing down slightly given the slightly bearish signals given by short-term moving averages. An assessment of moving averages reveals several bearish and bullish signals:
Bearish trend reversal : adaptative moving average 20
Type : Bearish
Timeframe : 1 hour
Bearish trend reversal : adaptative moving average 50
Type : Bearish
Timeframe : 1 hour
Bearish price crossover with Moving Average 20
Type : Bearish
Timeframe : 1 hour
Bullish price crossover with adaptative moving average 20
Type : Bullish
Timeframe : 1 hour
In fact, Central Analyzer took into account 18 technical indicators and the result was as follows: 6 are bullish, 7 are neutral and 5 are bearish. Central Indicators, the detector scanner for these technical indicators has recently detected several signals:
RSI indicator is back under 50
Type : Bearish
Timeframe : 1 hour
Parabolic SAR indicator bearish reversal
Type : Bearish
Timeframe : 1 hour
Central Patterns, the market scanner focusing on chart patterns, resistances and supports found this result:
Near resistance of triangle
Type : Bearish
Timeframe : 1 hour
The Central Candlesticks scanner, specialised in Japanese candlesticks, did not identify any signals.
| S3 | S2 | S1 | Price | R1 | R2 | R3 | |
|---|---|---|---|---|---|---|---|
| ProTrendLines | 7.1291 | 7.5156 | 7.6037 | 7.6186 | 7.6523 | 7.6983 | 7.7309 |
| Change (%) | -6.43% | -1.35% | -0.20% | - | +0.44% | +1.05% | +1.47% |
| Change | -0.4895 | -0.1030 | -0.0149 | - | +0.0337 | +0.0797 | +0.1123 |
| Level | Major | Major | Intermediate | - | Major | Major | Minor |
Pivot points can also be used to set your price objectives. Here is the price situation in relation to pivot points:
| Pivot points | S3 | S2 | S1 | PP | R1 | R2 | R3 |
|---|---|---|---|---|---|---|---|
| Standard | 7.5700 | 7.5875 | 7.6034 | 7.6209 | 7.6368 | 7.6543 | 7.6702 |
| Camarilla | 7.6102 | 7.6133 | 7.6163 | 7.6194 | 7.6225 | 7.6255 | 7.6286 |
| Woodie | 7.5693 | 7.5871 | 7.6027 | 7.6205 | 7.6361 | 7.6539 | 7.6695 |
| Fibonacci | 7.5875 | 7.6002 | 7.6081 | 7.6209 | 7.6336 | 7.6415 | 7.6543 |
| Pivot points | S3 | S2 | S1 | PP | R1 | R2 | R3 |
|---|---|---|---|---|---|---|---|
| Standard | 7.4564 | 7.5389 | 7.5943 | 7.6768 | 7.7322 | 7.8147 | 7.8701 |
| Camarilla | 7.6118 | 7.6244 | 7.6371 | 7.6497 | 7.6623 | 7.6750 | 7.6876 |
| Woodie | 7.4429 | 7.5321 | 7.5808 | 7.6700 | 7.7187 | 7.8079 | 7.8566 |
| Fibonacci | 7.5389 | 7.5916 | 7.6241 | 7.6768 | 7.7295 | 7.7620 | 7.8147 |
| Pivot points | S3 | S2 | S1 | PP | R1 | R2 | R3 |
|---|---|---|---|---|---|---|---|
| Standard | 7.3936 | 7.4916 | 7.6185 | 7.7165 | 7.8434 | 7.9414 | 8.0683 |
| Camarilla | 7.6835 | 7.7041 | 7.7247 | 7.7453 | 7.7659 | 7.7865 | 7.8072 |
| Woodie | 7.4080 | 7.4988 | 7.6329 | 7.7237 | 7.8578 | 7.9486 | 8.0827 |
| Fibonacci | 7.4916 | 7.5776 | 7.6306 | 7.7165 | 7.8025 | 7.8555 | 7.9414 |
Numerical data
The following are the details of the technical indicators and moving averages that were collected to generate this technical analysis:
| RSI (14): | 47.98 | |
| MACD (12,26,9): | 0.0021 | |
| Directional Movement: | 2.1505 | |
| AROON (14): | 64.2857 | |
| DEMA (21): | 7.6282 | |
| Parabolic SAR (0,02-0,02-0,2): | 7.6207 | |
| Elder Ray (13): | -0.0020 | |
| Super Trend (3,10): | 7.6122 | |
| Zig ZAG (10): | 7.6237 | |
| VORTEX (21): | 0.9688 | |
| Stochastique (14,3,5): | 47.78 | |
| TEMA (21): | 7.6301 | |
| Williams %R (14): | -77.78 | |
| Chande Momentum Oscillator (20): | 0.0006 | |
| Repulse (5,40,3): | -0.1887 | |
| ROCnROLL: | 2 | |
| TRIX (15,9): | 0.0036 | |
| Courbe Coppock: | 0.24 |
| MA7: | 7.6426 | |
| MA20: | 7.7262 | |
| MA50: | 7.6988 | |
| MA100: | 7.7690 | |
| MAexp7: | 7.6269 | |
| MAexp20: | 7.6258 | |
| MAexp50: | 7.6263 | |
| MAexp100: | 7.6380 | |
| Price / MA7: | -0.31% | |
| Price / MA20: | -1.39% | |
| Price / MA50: | -1.04% | |
| Price / MA100: | -1.94% | |
| Price / MAexp7: | -0.11% | |
| Price / MAexp20: | -0.09% | |
| Price / MAexp50: | -0.10% | |
| Price / MAexp100: | -0.25% |
About author
Online


Add a comment
Comments
0 comments on the analysis CAD/SEK - 1H