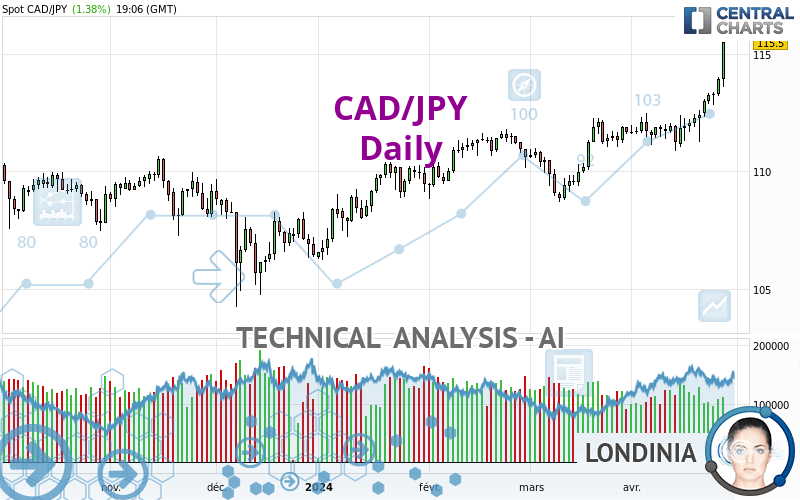
CAD/JPY - Daily - Technical analysis published on 04/26/2024 (GMT)
- 104
- 0
Click here for a new analysis!
- Timeframe : Daily
- - Analysis generated on
- Status : INVALID
Summary of the analysis

Additional analysis
Quotes
The CAD/JPY rating is 115.50 JPY. The price registered an increase of +1.38% on the session and was traded between 113.62 JPY and 115.52 JPY over the period. The price is currently at +1.65% from its lowest and -0.02% from its highest.So that you have an overall view of the price change, here is a table showing the variations over several periods:
New HIGH record (5 years)
Type : Bullish
Timeframe : Weekly
New HIGH record (1 year)
Type : Bullish
Timeframe : Weekly
New HIGH record (1st january)
Type : Bullish
Timeframe : Weekly
New HIGH record (1 month)
Type : Bullish
Timeframe : Weekly
Technical
Technical analysis of CAD/JPY in Daily shows a strongly overall bullish trend. 92.86% of the signals given by moving averages are bullish. This strongly bullish trend is supported by the strong bullish signals given by short-term moving averages. The Central Indicators scanner does not detect any result on moving averages that would impact this trend.
Technical indicators are strongly bullish, suggesting that the price increase should continue.
Caution: the Central Indicators scanner currently detects an excess:
RSI indicator is overbought : over 80
Type : Neutral
Timeframe : Daily
CCI indicator is overbought : over 100
Type : Neutral
Timeframe : Daily
Williams %R indicator is overbought : over -20
Type : Neutral
Timeframe : Daily
Pivot points : price is over resistance 3
Type : Neutral
Timeframe : Daily
Pivot points : price is over resistance 3
Type : Neutral
Timeframe : Weekly
The Central Patterns scanner, which studies chart patterns, resistances and supports, has identified these signals:
Near horizontal resistance
Type : Bearish
Timeframe : Daily
Resistance of channel is broken
Type : Bullish
Timeframe : Daily
No result was found by the Central Candlesticks scanner on Japanese candlesticks.
| S3 | S2 | S1 | Price | R1 | |
|---|---|---|---|---|---|
| ProTrendLines | 110.13 | 110.72 | 112.09 | 115.50 | 124.85 |
| Change (%) | -4.65% | -4.14% | -2.95% | - | +8.10% |
| Change | -5.37 | -4.78 | -3.41 | - | +9.35 |
| Level | Major | Minor | Major | - | Intermediate |
To determine price objectives, it is also possible to use the pivot points. Here is the price position in relation to pivot points:
| Pivot points | S3 | S2 | S1 | PP | R1 | R2 | R3 |
|---|---|---|---|---|---|---|---|
| Standard | 112.61 | 112.90 | 113.42 | 113.71 | 114.23 | 114.52 | 115.04 |
| Camarilla | 113.71 | 113.78 | 113.86 | 113.93 | 114.00 | 114.08 | 114.15 |
| Woodie | 112.72 | 112.96 | 113.53 | 113.77 | 114.34 | 114.58 | 115.15 |
| Fibonacci | 112.90 | 113.21 | 113.40 | 113.71 | 114.02 | 114.21 | 114.52 |
| Pivot points | S3 | S2 | S1 | PP | R1 | R2 | R3 |
|---|---|---|---|---|---|---|---|
| Standard | 109.87 | 110.46 | 111.44 | 112.03 | 113.01 | 113.60 | 114.58 |
| Camarilla | 111.98 | 112.12 | 112.27 | 112.41 | 112.55 | 112.70 | 112.84 |
| Woodie | 110.06 | 110.56 | 111.63 | 112.13 | 113.20 | 113.70 | 114.77 |
| Fibonacci | 110.46 | 111.06 | 111.43 | 112.03 | 112.63 | 113.00 | 113.60 |
| Pivot points | S3 | S2 | S1 | PP | R1 | R2 | R3 |
|---|---|---|---|---|---|---|---|
| Standard | 105.87 | 107.27 | 109.48 | 110.88 | 113.09 | 114.49 | 116.70 |
| Camarilla | 110.69 | 111.02 | 111.35 | 111.68 | 112.01 | 112.34 | 112.67 |
| Woodie | 106.27 | 107.47 | 109.88 | 111.08 | 113.49 | 114.69 | 117.10 |
| Fibonacci | 107.27 | 108.65 | 109.50 | 110.88 | 112.26 | 113.11 | 114.49 |
Numerical data
The following is the status of the technical indicators and moving averages at the time of publication of this technical analysis:
| RSI (14): | 81.64 | |
| MACD (12,26,9): | 0.7700 | |
| Directional Movement: | 22.10 | |
| AROON (14): | 71.43 | |
| DEMA (21): | 113.49 | |
| Parabolic SAR (0,02-0,02-0,2): | 112.02 | |
| Elder Ray (13): | 1.54 | |
| Super Trend (3,10): | 112.01 | |
| Zig ZAG (10): | 115.48 | |
| VORTEX (21): | 1.1500 | |
| Stochastique (14,3,5): | 98.09 | |
| TEMA (21): | 113.91 | |
| Williams %R (14): | -0.43 | |
| Chande Momentum Oscillator (20): | 3.74 | |
| Repulse (5,40,3): | 2.9200 | |
| ROCnROLL: | 1 | |
| TRIX (15,9): | 0.0600 | |
| Courbe Coppock: | 3.02 |
| MA7: | 113.38 | |
| MA20: | 112.34 | |
| MA50: | 111.42 | |
| MA100: | 110.06 | |
| MAexp7: | 113.65 | |
| MAexp20: | 112.58 | |
| MAexp50: | 111.59 | |
| MAexp100: | 110.60 | |
| Price / MA7: | +1.87% | |
| Price / MA20: | +2.81% | |
| Price / MA50: | +3.66% | |
| Price / MA100: | +4.94% | |
| Price / MAexp7: | +1.63% | |
| Price / MAexp20: | +2.59% | |
| Price / MAexp50: | +3.50% | |
| Price / MAexp100: | +4.43% |
News
Don't forget to follow the news on CAD/JPY. At the time of publication of this analysis, the latest news was as follows:
-
 CAD/JPY Forecast March 7, 2023
-
CAD/JPY Forecast October 4, 2022
-
CAD/JPY Forecast September 19, 2022
-
USDJPY and CADJPY Push Reversal Risk as S&P 500 Mocks Technical Levels
-
S&P 500 Breaks Resistance and Immediately Stalls as CADJPY Explodes Higher
About author

Online


Add a comment
Comments
0 comments on the analysis CAD/JPY - Daily