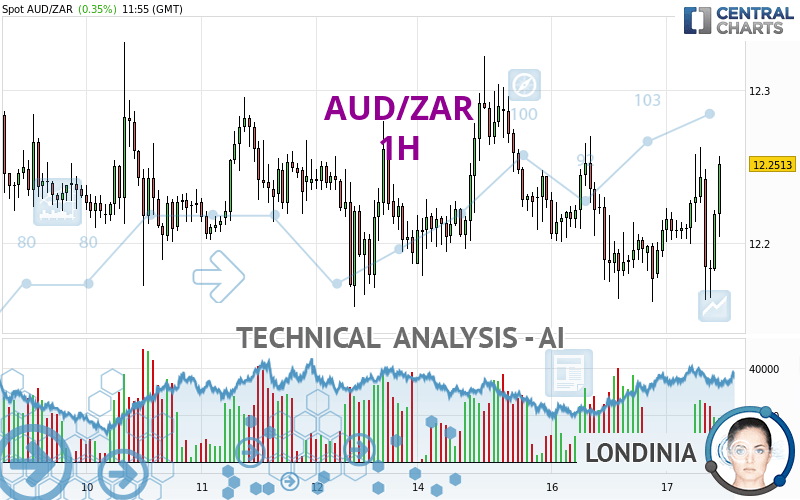
AUD/ZAR - 1H - Technical analysis published on 04/17/2024 (GMT)
- 66
- 0
Click here for a new analysis!
- Timeframe : 1H
- - Analysis generated on
- Status : LEVEL MAINTAINED
Summary of the analysis

Additional analysis
Quotes
The AUD/ZAR rating is 12.2529 ZAR. On the day, this instrument gained +0.37% with the lowest point at 12.1625 ZAR and the highest point at 12.2628 ZAR. The deviation from the price is +0.74% for the low point and -0.08% for the high point.A bullish opening was detected by the Central Gaps scanner. Buyers are trying to impose a bullish momentum in the very short term.
Bullish opening
Type : Bullish
Timeframe : Openning
So that you have an overall view of the price change, here is a table showing the variations over several periods:
Near a new LOW record (1 year)
Type : Bearish
Timeframe : Weekly
Near a new HIGH record (1st january)
Type : Bullish
Timeframe : Weekly
Near a new HIGH record (1 month)
Type : Bullish
Timeframe : Weekly
Technical
Technical analysis of AUD/ZAR in 1H shows an overall slightly bullish trend. Only 53.57% of the signals given by moving averages are bullish. This slightly bullish trend is reinforced by the strong signals currently being given by short-term moving averages. The Central Indicators market scanner is currently detecting several bullish signals that could impact this trend:
Bullish trend reversal : Moving Average 20
Type : Bullish
Timeframe : 1 hour
Bullish trend reversal : adaptative moving average 20
Type : Bullish
Timeframe : 1 hour
Bullish trend reversal : adaptative moving average 50
Type : Bullish
Timeframe : 1 hour
Bullish price crossover with Moving Average 50
Type : Bullish
Timeframe : 1 hour
Bullish price crossover with Moving Average 100
Type : Bullish
Timeframe : 1 hour
Bullish price crossover with adaptative moving average 20
Type : Bullish
Timeframe : 1 hour
Bullish price crossover with adaptative moving average 50
Type : Bullish
Timeframe : 1 hour
Bullish price crossover with adaptative moving average 100
Type : Bullish
Timeframe : 1 hour
An assessment of technical indicators shows a strong bullish signal.
Caution: the Central Indicators scanner currently detects an excess:
CCI indicator is overbought : over 100
Type : Neutral
Timeframe : 1 hour
Williams %R indicator is overbought : over -20
Type : Neutral
Timeframe : 1 hour
Ichimoku : price is over the cloud
Type : Bullish
Timeframe : 1 hour
MACD indicator is back over 0
Type : Bullish
Timeframe : 1 hour
Price is back over the pivot point
Type : Bullish
Timeframe : Weekly
Central Patterns, the scanner specializing in chart patterns, did not identify any signals.
The Central Candlesticks scanner which studies Japanese candlesticks did not detect anything.
| S3 | S2 | S1 | Price | R1 | R2 | R3 | |
|---|---|---|---|---|---|---|---|
| ProTrendLines | 12.1037 | 12.1720 | 12.2136 | 12.2529 | 12.2697 | 12.2975 | 12.3212 |
| Change (%) | -1.22% | -0.66% | -0.32% | - | +0.14% | +0.36% | +0.56% |
| Change | -0.1492 | -0.0809 | -0.0393 | - | +0.0168 | +0.0446 | +0.0683 |
| Level | Minor | Intermediate | Major | - | Minor | Intermediate | Major |
Pivot points can also be used to set your price objectives. Here is the price situation in relation to pivot points:
| Pivot points | S3 | S2 | S1 | PP | R1 | R2 | R3 |
|---|---|---|---|---|---|---|---|
| Standard | 12.0475 | 12.1044 | 12.1563 | 12.2132 | 12.2651 | 12.3220 | 12.3739 |
| Camarilla | 12.1783 | 12.1883 | 12.1982 | 12.2082 | 12.2182 | 12.2282 | 12.2381 |
| Woodie | 12.0450 | 12.1032 | 12.1538 | 12.2120 | 12.2626 | 12.3208 | 12.3714 |
| Fibonacci | 12.1044 | 12.1460 | 12.1716 | 12.2132 | 12.2548 | 12.2804 | 12.3220 |
| Pivot points | S3 | S2 | S1 | PP | R1 | R2 | R3 |
|---|---|---|---|---|---|---|---|
| Standard | 11.9511 | 12.0547 | 12.1241 | 12.2277 | 12.2971 | 12.4007 | 12.4701 |
| Camarilla | 12.1460 | 12.1619 | 12.1777 | 12.1936 | 12.2095 | 12.2253 | 12.2412 |
| Woodie | 11.9341 | 12.0462 | 12.1071 | 12.2192 | 12.2801 | 12.3922 | 12.4531 |
| Fibonacci | 12.0547 | 12.1208 | 12.1616 | 12.2277 | 12.2938 | 12.3346 | 12.4007 |
| Pivot points | S3 | S2 | S1 | PP | R1 | R2 | R3 |
|---|---|---|---|---|---|---|---|
| Standard | 11.9219 | 12.0857 | 12.1807 | 12.3445 | 12.4395 | 12.6033 | 12.6983 |
| Camarilla | 12.2046 | 12.2284 | 12.2521 | 12.2758 | 12.2995 | 12.3233 | 12.3470 |
| Woodie | 11.8876 | 12.0685 | 12.1464 | 12.3273 | 12.4052 | 12.5861 | 12.6640 |
| Fibonacci | 12.0857 | 12.1845 | 12.2456 | 12.3445 | 12.4433 | 12.5044 | 12.6033 |
Numerical data
The following is the status of the technical indicators and moving averages at the time of publication of this technical analysis:
| RSI (14): | 59.68 | |
| MACD (12,26,9): | 0.0022 | |
| Directional Movement: | 9.9131 | |
| AROON (14): | 71.4286 | |
| DEMA (21): | 12.2140 | |
| Parabolic SAR (0,02-0,02-0,2): | 12.2588 | |
| Elder Ray (13): | 0.0155 | |
| Super Trend (3,10): | 12.2604 | |
| Zig ZAG (10): | 12.2488 | |
| VORTEX (21): | 1.0668 | |
| Stochastique (14,3,5): | 55.05 | |
| TEMA (21): | 12.2201 | |
| Williams %R (14): | -12.86 | |
| Chande Momentum Oscillator (20): | 0.0417 | |
| Repulse (5,40,3): | 0.5436 | |
| ROCnROLL: | 1 | |
| TRIX (15,9): | -0.0020 | |
| Courbe Coppock: | 0.38 |
| MA7: | 12.2258 | |
| MA20: | 12.2891 | |
| MA50: | 12.3587 | |
| MA100: | 12.4061 | |
| MAexp7: | 12.2196 | |
| MAexp20: | 12.2130 | |
| MAexp50: | 12.2167 | |
| MAexp100: | 12.2247 | |
| Price / MA7: | +0.22% | |
| Price / MA20: | -0.29% | |
| Price / MA50: | -0.86% | |
| Price / MA100: | -1.23% | |
| Price / MAexp7: | +0.27% | |
| Price / MAexp20: | +0.33% | |
| Price / MAexp50: | +0.30% | |
| Price / MAexp100: | +0.23% |
About author
Online


Add a comment
Comments
0 comments on the analysis AUD/ZAR - 1H