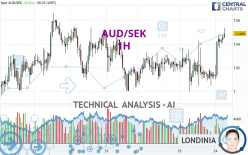
AUD/SEK - 1H - Technical analysis published on 04/24/2024 (GMT)
- Who voted?
- 81
- 0
Click here for a new analysis!
- Timeframe : 1H
- - Analysis generated on
- Status : TARGET REACHED

Summary of the analysis

Additional analysis
Quotes
The AUD/SEK price is 7.0485 SEK. On the day, this instrument gained +0.51% and was between 7.0101 SEK and 7.0535 SEK. This implies that the price is at +0.55% from its lowest and at -0.07% from its highest.The Central Gaps scanner detects a bullish opening marking the presence of buyers ahead of sellers at the opening but not sufficiently marked to allow the price to register a quotation gap.
Bullish opening
Type : Bullish
Timeframe : Openning
So that you have an overall view of the price change, here is a table showing the variations over several periods:
Near a new HIGH record (1 year)
Type : Bullish
Timeframe : Weekly
Near a new LOW record (1st january)
Type : Bearish
Timeframe : Weekly
Near a new LOW record (1 month)
Type : Bearish
Timeframe : Weekly
Technical
A technical analysis in 1H of this AUD/SEK chart shows a bullish trend. 75.00% of the signals given by moving averages are bullish. The overall trend is reinforced by the strong bullish signals from short-term moving averages. An assessment of moving averages reveals a bullish signal that could impact this trend:
Moving Average bullish crossovers : AMA20 & AMA50
Type : Bullish
Timeframe : 1 hour
In fact, 16 technical indicators on 18 studied are currently positioned bullish. But beware of excesses. The Central Indicators scanner currently detects this:
RSI indicator is overbought : over 70
Type : Neutral
Timeframe : 1 hour
CCI indicator is overbought : over 100
Type : Neutral
Timeframe : 1 hour
Williams %R indicator is overbought : over -20
Type : Neutral
Timeframe : 1 hour
Pivot points : price is over resistance 1
Type : Neutral
Timeframe : 1 hour
Pivot points : price is over resistance 1
Type : Neutral
Timeframe : Weekly
The Central Patterns scanner, which studies chart patterns, resistances and supports, has identified these signals:
Horizontal resistance is broken
Type : Bullish
Timeframe : 1 hour
Resistance of channel is broken
Type : Bullish
Timeframe : 1 hour
The Central Candlesticks scanner, specialised in Japanese candlesticks, did not identify any signals.
| S3 | S2 | S1 | Price | R1 | R2 | R3 | |
|---|---|---|---|---|---|---|---|
| ProTrendLines | 7.0162 | 7.0365 | 7.0428 | 7.0485 | 7.0660 | 7.1283 | 7.1687 |
| Change (%) | -0.46% | -0.17% | -0.08% | - | +0.25% | +1.13% | +1.71% |
| Change | -0.0323 | -0.0120 | -0.0057 | - | +0.0175 | +0.0798 | +0.1202 |
| Level | Minor | Major | Minor | - | Intermediate | Minor | Intermediate |
Attention could also be paid to pivot points to set price objectives:
| Pivot points | S3 | S2 | S1 | PP | R1 | R2 | R3 |
|---|---|---|---|---|---|---|---|
| Standard | 6.9509 | 6.9753 | 6.9941 | 7.0185 | 7.0373 | 7.0617 | 7.0805 |
| Camarilla | 7.0011 | 7.0051 | 7.0090 | 7.0130 | 7.0170 | 7.0209 | 7.0249 |
| Woodie | 6.9482 | 6.9739 | 6.9914 | 7.0171 | 7.0346 | 7.0603 | 7.0778 |
| Fibonacci | 6.9753 | 6.9918 | 7.0020 | 7.0185 | 7.0350 | 7.0452 | 7.0617 |
| Pivot points | S3 | S2 | S1 | PP | R1 | R2 | R3 |
|---|---|---|---|---|---|---|---|
| Standard | 6.9090 | 6.9528 | 6.9785 | 7.0223 | 7.0480 | 7.0918 | 7.1175 |
| Camarilla | 6.9851 | 6.9915 | 6.9978 | 7.0042 | 7.0106 | 7.0169 | 7.0233 |
| Woodie | 6.9000 | 6.9483 | 6.9695 | 7.0178 | 7.0390 | 7.0873 | 7.1085 |
| Fibonacci | 6.9528 | 6.9794 | 6.9958 | 7.0223 | 7.0489 | 7.0653 | 7.0918 |
| Pivot points | S3 | S2 | S1 | PP | R1 | R2 | R3 |
|---|---|---|---|---|---|---|---|
| Standard | 6.4921 | 6.6044 | 6.7760 | 6.8883 | 7.0599 | 7.1722 | 7.3438 |
| Camarilla | 6.8694 | 6.8955 | 6.9215 | 6.9475 | 6.9735 | 6.9996 | 7.0256 |
| Woodie | 6.5217 | 6.6192 | 6.8056 | 6.9031 | 7.0895 | 7.1870 | 7.3734 |
| Fibonacci | 6.6044 | 6.7129 | 6.7799 | 6.8883 | 6.9968 | 7.0638 | 7.1722 |
Numerical data
The following are the details of the technical indicators and moving averages that were collected to generate this technical analysis:
| RSI (14): | 69.85 | |
| MACD (12,26,9): | 0.0065 | |
| Directional Movement: | 19.5037 | |
| AROON (14): | 64.2857 | |
| DEMA (21): | 7.0360 | |
| Parabolic SAR (0,02-0,02-0,2): | 7.0125 | |
| Elder Ray (13): | 0.0164 | |
| Super Trend (3,10): | 7.0183 | |
| Zig ZAG (10): | 7.0475 | |
| VORTEX (21): | 1.1382 | |
| Stochastique (14,3,5): | 91.97 | |
| TEMA (21): | 7.0424 | |
| Williams %R (14): | -7.58 | |
| Chande Momentum Oscillator (20): | 0.0342 | |
| Repulse (5,40,3): | 0.1943 | |
| ROCnROLL: | 1 | |
| TRIX (15,9): | 0.0048 | |
| Courbe Coppock: | 0.65 |
| MA7: | 7.0298 | |
| MA20: | 7.0071 | |
| MA50: | 6.8821 | |
| MA100: | 6.8707 | |
| MAexp7: | 7.0400 | |
| MAexp20: | 7.0293 | |
| MAexp50: | 7.0251 | |
| MAexp100: | 7.0246 | |
| Price / MA7: | +0.27% | |
| Price / MA20: | +0.59% | |
| Price / MA50: | +2.42% | |
| Price / MA100: | +2.59% | |
| Price / MAexp7: | +0.12% | |
| Price / MAexp20: | +0.27% | |
| Price / MAexp50: | +0.33% | |
| Price / MAexp100: | +0.34% |
About author
Online


Add a comment
Comments
0 comments on the analysis AUD/SEK - 1H