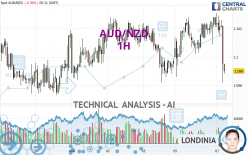
AUD/NZD - 1H - Technical analysis published on 05/07/2024 (GMT)
- 85
- 0
Click here for a new analysis!
- Timeframe : 1H
- - Analysis generated on
- Status : TARGET REACHED

Summary of the analysis

Additional analysis
Quotes
AUD/NZD rating 1.0990 NZD. On the day, this instrument lost -0.30% with the lowest point at 1.0982 NZD and the highest point at 1.1031 NZD. The deviation from the price is +0.07% for the low point and -0.37% for the high point.So that you have an overall view of the price change, here is a table showing the variations over several periods:
Near a new HIGH record (5 years)
Type : Bullish
Timeframe : Weekly
Near a new LOW record (1 year)
Type : Bearish
Timeframe : Weekly
New HIGH record (1st january)
Type : Bullish
Timeframe : Weekly
New HIGH record (1 month)
Type : Bullish
Timeframe : Weekly
Technical
Technical analysis of AUD/NZD in 1H shows an overall slightly bearish trend. 60.71% of the signals given by moving averages are bearish. The overall trend could accelerate as a result of the strong bearish signals from short-term moving averages. The Central Indicators scanner detects bearish signals on moving averages that could impact this trend:
Bearish trend reversal : Moving Average 20
Type : Bearish
Timeframe : 1 hour
Bearish trend reversal : adaptative moving average 20
Type : Bearish
Timeframe : 1 hour
Bearish trend reversal : adaptative moving average 50
Type : Bearish
Timeframe : 1 hour
Bearish trend reversal : adaptative moving average 100
Type : Bearish
Timeframe : 1 hour
Moving Average bearish crossovers : MA50 & MA100
Type : Bearish
Timeframe : 1 hour
In fact, according to the parameters integrated into the Central Analyzer system, 13 technical indicators out of 18 analysed are currently bearish. Caution: the Central Indicators scanner currently detects an excess:
CCI indicator is oversold : under -100
Type : Neutral
Timeframe : 1 hour
Previous candle closed under Bollinger bands
Type : Neutral
Timeframe : 1 hour
Williams %R indicator is oversold : under -80
Type : Neutral
Timeframe : 1 hour
Pivot points : price is under support 1
Type : Neutral
Timeframe : 1 hour
MACD indicator is back under 0
Type : Bearish
Timeframe : 1 hour
Price is back under the pivot point
Type : Bearish
Timeframe : Weekly
Central Patterns, the market scanner focusing on chart patterns, resistances and supports found this result:
Near resistance of triangle
Type : Bearish
Timeframe : 1 hour
The Central Candlesticks scanner which studies Japanese candlesticks did not detect anything.
| S3 | S2 | S1 | Price | R1 | R2 | R3 | |
|---|---|---|---|---|---|---|---|
| ProTrendLines | 1.0923 | 1.0938 | 1.0974 | 1.0990 | 1.0993 | 1.1013 | 1.1028 |
| Change (%) | -0.61% | -0.47% | -0.15% | - | +0.03% | +0.21% | +0.35% |
| Change | -0.0067 | -0.0052 | -0.0016 | - | +0.0003 | +0.0023 | +0.0038 |
| Level | Major | Minor | Major | - | Minor | Intermediate | Intermediate |
To determine price objectives, it is also possible to use the pivot points. Here is the price position in relation to pivot points:
| Pivot points | S3 | S2 | S1 | PP | R1 | R2 | R3 |
|---|---|---|---|---|---|---|---|
| Standard | 1.0955 | 1.0970 | 1.0997 | 1.1012 | 1.1039 | 1.1054 | 1.1081 |
| Camarilla | 1.1012 | 1.1015 | 1.1019 | 1.1023 | 1.1027 | 1.1031 | 1.1035 |
| Woodie | 1.0960 | 1.0973 | 1.1002 | 1.1015 | 1.1044 | 1.1057 | 1.1086 |
| Fibonacci | 1.0970 | 1.0986 | 1.0996 | 1.1012 | 1.1028 | 1.1038 | 1.1054 |
| Pivot points | S3 | S2 | S1 | PP | R1 | R2 | R3 |
|---|---|---|---|---|---|---|---|
| Standard | 1.0884 | 1.0919 | 1.0958 | 1.0993 | 1.1032 | 1.1067 | 1.1106 |
| Camarilla | 1.0977 | 1.0983 | 1.0990 | 1.0997 | 1.1004 | 1.1011 | 1.1017 |
| Woodie | 1.0886 | 1.0920 | 1.0960 | 1.0994 | 1.1034 | 1.1068 | 1.1108 |
| Fibonacci | 1.0919 | 1.0947 | 1.0965 | 1.0993 | 1.1021 | 1.1039 | 1.1067 |
| Pivot points | S3 | S2 | S1 | PP | R1 | R2 | R3 |
|---|---|---|---|---|---|---|---|
| Standard | 1.0747 | 1.0802 | 1.0909 | 1.0964 | 1.1071 | 1.1126 | 1.1233 |
| Camarilla | 1.0972 | 1.0986 | 1.1001 | 1.1016 | 1.1031 | 1.1046 | 1.1061 |
| Woodie | 1.0773 | 1.0815 | 1.0935 | 1.0977 | 1.1097 | 1.1139 | 1.1259 |
| Fibonacci | 1.0802 | 1.0864 | 1.0902 | 1.0964 | 1.1026 | 1.1064 | 1.1126 |
Numerical data
The following is the status of the technical indicators and moving averages at the time of publication of this technical analysis:
| RSI (14): | 33.71 | |
| MACD (12,26,9): | -0.0001 | |
| Directional Movement: | -26.2008 | |
| AROON (14): | -28.5714 | |
| DEMA (21): | 1.1014 | |
| Parabolic SAR (0,02-0,02-0,2): | 1.1030 | |
| Elder Ray (13): | -0.0021 | |
| Super Trend (3,10): | 1.1026 | |
| Zig ZAG (10): | 1.0990 | |
| VORTEX (21): | 0.9000 | |
| Stochastique (14,3,5): | 33.30 | |
| TEMA (21): | 1.1011 | |
| Williams %R (14): | -85.71 | |
| Chande Momentum Oscillator (20): | -0.0030 | |
| Repulse (5,40,3): | -0.2533 | |
| ROCnROLL: | 2 | |
| TRIX (15,9): | 0.0032 | |
| Courbe Coppock: | 0.06 |
| MA7: | 1.1006 | |
| MA20: | 1.0945 | |
| MA50: | 1.0865 | |
| MA100: | 1.0794 | |
| MAexp7: | 1.1009 | |
| MAexp20: | 1.1014 | |
| MAexp50: | 1.1013 | |
| MAexp100: | 1.1007 | |
| Price / MA7: | -0.15% | |
| Price / MA20: | +0.41% | |
| Price / MA50: | +1.15% | |
| Price / MA100: | +1.82% | |
| Price / MAexp7: | -0.17% | |
| Price / MAexp20: | -0.22% | |
| Price / MAexp50: | -0.21% | |
| Price / MAexp100: | -0.15% |
News
The last news published on AUD/NZD at the time of the generation of this analysis was as follows:
-
 Trading volatility: AUD/NZD on RBNZ rate decision
-
Trade of the Week: long AUD/NZD
-
#AUDNZD at six-week high as RBA considers raising rates...
-
Trading the Trend: short AUD/NZD
-
Australian Dollar Analysis: AUD/USD and AUD/NZD May Bounce Before Selloff Resumes
About author

Online


Add a comment
Comments
0 comments on the analysis AUD/NZD - 1H