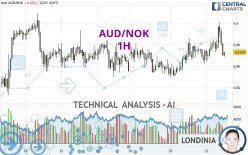
AUD/NOK - 1H - Technical analysis published on 02/21/2024 (GMT)
- 86
- 0
Click here for a new analysis!
- Timeframe : 1H
- - Analysis generated on
- Status : INVALID

Summary of the analysis

Additional analysis
Quotes
The AUD/NOK price is 6.8729 NOK. The price registered a decrease of -0.02% on the session and was between 6.8637 NOK and 6.9009 NOK. This implies that the price is at +0.13% from its lowest and at -0.41% from its highest.The Central Gaps scanner detects a bullish opening. A small advantage for buyers in the very short term.
Bullish opening
Type : Bullish
Timeframe : Openning
A study of price movements over other periods shows the following variations:
Near a new LOW record (1 year)
Type : Bearish
Timeframe : Weekly
Near a new HIGH record (1st january)
Type : Bullish
Timeframe : Weekly
Near a new HIGH record (1 month)
Type : Bullish
Timeframe : Weekly
Technical
Technical analysis of AUD/NOK in 1H shows an overall bullish trend. 67.86% of the signals given by moving averages are bullish. Caution: the neutral signals currently given by the short-term moving averages indicate that this bullish trend is showing signs of running out of steam. An assessment of moving averages reveals several bearish signals that could impact this trend:
Bearish trend reversal : Moving Average 20
Type : Bearish
Timeframe : 1 hour
Bearish trend reversal : adaptative moving average 20
Type : Bearish
Timeframe : 1 hour
On the 18 technical indicators analysed, 4 are bullish, 6 are neutral and 8 are bearish. Central Indicators, the detector scanner for these technical indicators recently detected a signal:
Momentum indicator is back over 0
Type : Bullish
Timeframe : 1 hour
An analysis of the price chart with the Central Patterns scanner (detector of chart patterns and resistances and supports) shows several results that can have an impact on the price change:
Near horizontal resistance
Type : Bearish
Timeframe : 1 hour
Near resistance of triangle
Type : Bearish
Timeframe : 1 hour
Resistance of channel is broken
Type : Bullish
Timeframe : 1 hour
Central Candlesticks, the scanner specialised in Japanese candlesticks, detects this inversion signal that could impact the current short-term trend:
Doji
Type : Neutral
Timeframe : 1 hour
| S3 | S2 | S1 | Price | R1 | R2 | R3 | |
|---|---|---|---|---|---|---|---|
| ProTrendLines | 6.8413 | 6.8499 | 6.8660 | 6.8729 | 6.8857 | 6.8935 | 6.9097 |
| Change (%) | -0.46% | -0.33% | -0.10% | - | +0.19% | +0.30% | +0.54% |
| Change | -0.0316 | -0.0230 | -0.0069 | - | +0.0128 | +0.0206 | +0.0368 |
| Level | Minor | Major | Minor | - | Minor | Minor | Intermediate |
Attention could also be paid to pivot points to set price objectives:
| Pivot points | S3 | S2 | S1 | PP | R1 | R2 | R3 |
|---|---|---|---|---|---|---|---|
| Standard | 6.8184 | 6.8342 | 6.8541 | 6.8699 | 6.8898 | 6.9056 | 6.9255 |
| Camarilla | 6.8642 | 6.8675 | 6.8707 | 6.8740 | 6.8773 | 6.8806 | 6.8838 |
| Woodie | 6.8205 | 6.8352 | 6.8562 | 6.8709 | 6.8919 | 6.9066 | 6.9276 |
| Fibonacci | 6.8342 | 6.8478 | 6.8563 | 6.8699 | 6.8835 | 6.8920 | 6.9056 |
| Pivot points | S3 | S2 | S1 | PP | R1 | R2 | R3 |
|---|---|---|---|---|---|---|---|
| Standard | 6.7449 | 6.7887 | 6.8220 | 6.8658 | 6.8991 | 6.9429 | 6.9762 |
| Camarilla | 6.8340 | 6.8411 | 6.8481 | 6.8552 | 6.8623 | 6.8693 | 6.8764 |
| Woodie | 6.7396 | 6.7861 | 6.8167 | 6.8632 | 6.8938 | 6.9403 | 6.9709 |
| Fibonacci | 6.7887 | 6.8182 | 6.8364 | 6.8658 | 6.8953 | 6.9135 | 6.9429 |
| Pivot points | S3 | S2 | S1 | PP | R1 | R2 | R3 |
|---|---|---|---|---|---|---|---|
| Standard | 6.6648 | 6.7565 | 6.8297 | 6.9214 | 6.9946 | 7.0863 | 7.1595 |
| Camarilla | 6.8577 | 6.8728 | 6.8879 | 6.9030 | 6.9181 | 6.9332 | 6.9484 |
| Woodie | 6.6557 | 6.7519 | 6.8206 | 6.9168 | 6.9855 | 7.0817 | 7.1504 |
| Fibonacci | 6.7565 | 6.8195 | 6.8584 | 6.9214 | 6.9844 | 7.0233 | 7.0863 |
Numerical data
The following is the status of technical indicators and moving averages registered at the time this technical analysis was created:
| RSI (14): | 48.27 | |
| MACD (12,26,9): | 0.0030 | |
| Directional Movement: | 1.7233 | |
| AROON (14): | 71.4285 | |
| DEMA (21): | 6.8812 | |
| Parabolic SAR (0,02-0,02-0,2): | 6.9003 | |
| Elder Ray (13): | -0.0073 | |
| Super Trend (3,10): | 6.8639 | |
| Zig ZAG (10): | 6.8734 | |
| VORTEX (21): | 1.0134 | |
| Stochastique (14,3,5): | 31.97 | |
| TEMA (21): | 6.8817 | |
| Williams %R (14): | -72.82 | |
| Chande Momentum Oscillator (20): | 0.0027 | |
| Repulse (5,40,3): | -0.1614 | |
| ROCnROLL: | -1 | |
| TRIX (15,9): | 0.0085 | |
| Courbe Coppock: | 0.25 |
| MA7: | 6.8702 | |
| MA20: | 6.8824 | |
| MA50: | 6.9251 | |
| MA100: | 6.9929 | |
| MAexp7: | 6.8784 | |
| MAexp20: | 6.8768 | |
| MAexp50: | 6.8722 | |
| MAexp100: | 6.8712 | |
| Price / MA7: | +0.04% | |
| Price / MA20: | -0.14% | |
| Price / MA50: | -0.75% | |
| Price / MA100: | -1.72% | |
| Price / MAexp7: | -0.08% | |
| Price / MAexp20: | -0.06% | |
| Price / MAexp50: | +0.01% | |
| Price / MAexp100: | +0.02% |
About author
Online


Add a comment
Comments
0 comments on the analysis AUD/NOK - 1H