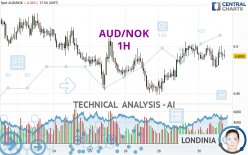
AUD/NOK - 1H - Technical analysis published on 01/30/2024 (GMT)
- 101
- 0
Click here for a new analysis!
- Timeframe : 1H
- - Analysis generated on
- Status : TARGET REACHED

Summary of the analysis

Additional analysis
Quotes
The AUD/NOK rating is 6.8895 NOK. The price is lower by -0.05% since the last closing and was between 6.8767 NOK and 6.9016 NOK. This implies that the price is at +0.19% from its lowest and at -0.18% from its highest.A study of price movements over other periods shows the following variations:
Near a new LOW record (1 year)
Type : Bearish
Timeframe : Weekly
Near a new HIGH record (1st january)
Type : Bullish
Timeframe : Weekly
Near a new HIGH record (1 month)
Type : Bullish
Timeframe : Weekly
Technical
A technical analysis in 1H of this AUD/NOK chart shows a bullish trend. The signals given by moving averages are 64.29% bullish. This bullish trend could slow down given the neutral signals currently being given by short-term moving averages. The Central Indicators scanner detects bullish and bearish signals on moving averages that could impact this trend:
Moving Average bullish crossovers : MA50 & MA100
Type : Bullish
Timeframe : 1 hour
Bearish price crossover with adaptative moving average 20
Type : Bearish
Timeframe : 1 hour
Bearish price crossover with adaptative moving average 100
Type : Bearish
Timeframe : 1 hour
In fact, Central Analyzer took into account 18 technical indicators and the result was as follows: 5 are bullish, 8 are neutral and 5 are bearish. Central Indicators, the scanner specialised in technical indicators, has identified these signals:
Price is back over the pivot point
Type : Bullish
Timeframe : Weekly
Williams %R indicator is back under -50
Type : Bearish
Timeframe : 1 hour
An analysis of the price chart with the Central Patterns scanner (detector of chart patterns and resistances and supports) shows several results that can have an impact on the price change:
Near resistance of channel
Type : Bearish
Timeframe : 1 hour
Near resistance of triangle
Type : Bearish
Timeframe : 1 hour
There is also a Japanese candlestick pattern detected by Central Candlesticks that could mark the end of the current short-term trend:
Doji
Type : Neutral
Timeframe : 1 hour
| S3 | S2 | S1 | Price | R1 | R2 | R3 | |
|---|---|---|---|---|---|---|---|
| ProTrendLines | 6.8535 | 6.8679 | 6.8807 | 6.8895 | 6.8902 | 6.9046 | 6.9114 |
| Change (%) | -0.52% | -0.31% | -0.13% | - | +0.01% | +0.22% | +0.32% |
| Change | -0.0360 | -0.0216 | -0.0088 | - | +0.0007 | +0.0151 | +0.0219 |
| Level | Intermediate | Minor | Major | - | Minor | Minor | Minor |
Attention could also be paid to pivot points to set price objectives:
| Pivot points | S3 | S2 | S1 | PP | R1 | R2 | R3 |
|---|---|---|---|---|---|---|---|
| Standard | 6.8033 | 6.8259 | 6.8593 | 6.8819 | 6.9153 | 6.9379 | 6.9713 |
| Camarilla | 6.8772 | 6.8823 | 6.8875 | 6.8926 | 6.8977 | 6.9029 | 6.9080 |
| Woodie | 6.8086 | 6.8286 | 6.8646 | 6.8846 | 6.9206 | 6.9406 | 6.9766 |
| Fibonacci | 6.8259 | 6.8473 | 6.8605 | 6.8819 | 6.9033 | 6.9165 | 6.9379 |
| Pivot points | S3 | S2 | S1 | PP | R1 | R2 | R3 |
|---|---|---|---|---|---|---|---|
| Standard | 6.7345 | 6.7913 | 6.8216 | 6.8784 | 6.9087 | 6.9655 | 6.9958 |
| Camarilla | 6.8280 | 6.8359 | 6.8439 | 6.8519 | 6.8599 | 6.8679 | 6.8759 |
| Woodie | 6.7213 | 6.7847 | 6.8084 | 6.8718 | 6.8955 | 6.9589 | 6.9826 |
| Fibonacci | 6.7913 | 6.8246 | 6.8451 | 6.8784 | 6.9117 | 6.9322 | 6.9655 |
| Pivot points | S3 | S2 | S1 | PP | R1 | R2 | R3 |
|---|---|---|---|---|---|---|---|
| Standard | 6.4478 | 6.6624 | 6.7951 | 7.0097 | 7.1424 | 7.3570 | 7.4897 |
| Camarilla | 6.8322 | 6.8640 | 6.8959 | 6.9277 | 6.9595 | 6.9914 | 7.0232 |
| Woodie | 6.4068 | 6.6419 | 6.7541 | 6.9892 | 7.1014 | 7.3365 | 7.4487 |
| Fibonacci | 6.6624 | 6.7951 | 6.8771 | 7.0097 | 7.1424 | 7.2244 | 7.3570 |
Numerical data
The following is the status of technical indicators and moving averages registered at the time this technical analysis was created:
| RSI (14): | 51.29 | |
| MACD (12,26,9): | 0.0010 | |
| Directional Movement: | 3.2363 | |
| AROON (14): | -35.7143 | |
| DEMA (21): | 6.8912 | |
| Parabolic SAR (0,02-0,02-0,2): | 6.8790 | |
| Elder Ray (13): | 0.0023 | |
| Super Trend (3,10): | 6.8713 | |
| Zig ZAG (10): | 6.8889 | |
| VORTEX (21): | 0.9775 | |
| Stochastique (14,3,5): | 54.48 | |
| TEMA (21): | 6.8891 | |
| Williams %R (14): | -53.41 | |
| Chande Momentum Oscillator (20): | -0.0090 | |
| Repulse (5,40,3): | -0.1071 | |
| ROCnROLL: | -1 | |
| TRIX (15,9): | 0.0035 | |
| Courbe Coppock: | 0.10 |
| MA7: | 6.8892 | |
| MA20: | 6.9066 | |
| MA50: | 6.9954 | |
| MA100: | 6.9968 | |
| MAexp7: | 6.8895 | |
| MAexp20: | 6.8893 | |
| MAexp50: | 6.8861 | |
| MAexp100: | 6.8865 | |
| Price / MA7: | +0.00% | |
| Price / MA20: | -0.25% | |
| Price / MA50: | -1.51% | |
| Price / MA100: | -1.53% | |
| Price / MAexp7: | -0% | |
| Price / MAexp20: | +0.00% | |
| Price / MAexp50: | +0.05% | |
| Price / MAexp100: | +0.04% |
About author
Online


Add a comment
Comments
0 comments on the analysis AUD/NOK - 1H