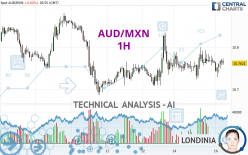
AUD/MXN - 1H - Technical analysis published on 04/16/2024 (GMT)
- 82
- 0
- Timeframe : 1H
- - Analysis generated on
- Status : NEUTRAL

Summary of the analysis

Additional analysis
Quotes
AUD/MXN rating 10.7621 MXN. The price registered a decrease of -0.02% on the session and was traded between 10.7296 MXN and 10.7740 MXN over the period. The price is currently at +0.30% from its lowest and -0.11% from its highest.The Central Gaps scanner detects a bullish opening. A small advantage for buyers in the very short term.
Bullish opening
Type : Bullish
Timeframe : Openning
So that you have an overall view of the price change, here is a table showing the variations over several periods:
Near a new LOW record (5 years)
Type : Bearish
Timeframe : Weekly
Near a new LOW record (1 year)
Type : Bearish
Timeframe : Weekly
Near a new LOW record (1st january)
Type : Bearish
Timeframe : Weekly
Near a new HIGH record (1 month)
Type : Bullish
Timeframe : Weekly
Technical
Technical analysis of AUD/MXN in 1H shows a neutral overall trend. This indecision could turn into a bullish trend due to the slightly bullish signals currently given by short-term moving averages. The Central Indicators scanner detects a bearish signal on moving averages that could impact this trend:
Bearish price crossover with Moving Average 20
Type : Bearish
Timeframe : 1 hour
In fact, of the 18 technical indicators analysed by Central Analyzer, 4 are bullish, 7 are neutral and 7 are bearish. But beware of excesses. The Central Indicators scanner currently detects this:
MACD indicator: bearish divergence
Type : Bearish
Timeframe : 1 hour
RSI indicator is back under 50
Type : Bearish
Timeframe : 1 hour
Price is back under the pivot point
Type : Bearish
Timeframe : 1 hour
Momentum indicator is back under 0
Type : Bearish
Timeframe : 1 hour
Williams %R indicator is back under -50
Type : Bearish
Timeframe : 1 hour
Central Patterns, the market scanner focusing on chart patterns, resistances and supports found these results:
Near resistance of triangle
Type : Bearish
Timeframe : 1 hour
Near horizontal support
Type : Bullish
Timeframe : 1 hour
For a small setback in the very short term, the Central Candlesticks scanner currently notes the presence of this bearish pattern in Japanese candlesticks:
Bearish engulfing lines
Type : Bearish
Timeframe : 1 hour
| S3 | S2 | S1 | Price | R1 | R2 | R3 | |
|---|---|---|---|---|---|---|---|
| ProTrendLines | 8.1752 | 10.6863 | 10.7220 | 10.7621 | 10.7654 | 10.8346 | 10.8813 |
| Change (%) | -24.04% | -0.70% | -0.37% | - | +0.03% | +0.67% | +1.11% |
| Change | -2.5869 | -0.0758 | -0.0401 | - | +0.0033 | +0.0725 | +0.1192 |
| Level | Intermediate | Minor | Major | - | Intermediate | Intermediate | Intermediate |
Attention could also be paid to pivot points to set price objectives:
| Pivot points | S3 | S2 | S1 | PP | R1 | R2 | R3 |
|---|---|---|---|---|---|---|---|
| Standard | 10.6484 | 10.6861 | 10.7250 | 10.7627 | 10.8016 | 10.8393 | 10.8782 |
| Camarilla | 10.7427 | 10.7498 | 10.7568 | 10.7638 | 10.7708 | 10.7778 | 10.7849 |
| Woodie | 10.6489 | 10.6864 | 10.7255 | 10.7630 | 10.8021 | 10.8396 | 10.8787 |
| Fibonacci | 10.6861 | 10.7154 | 10.7335 | 10.7627 | 10.7920 | 10.8101 | 10.8393 |
| Pivot points | S3 | S2 | S1 | PP | R1 | R2 | R3 |
|---|---|---|---|---|---|---|---|
| Standard | 10.4722 | 10.5792 | 10.6672 | 10.7742 | 10.8622 | 10.9692 | 11.0572 |
| Camarilla | 10.7015 | 10.7194 | 10.7372 | 10.7551 | 10.7730 | 10.7909 | 10.8087 |
| Woodie | 10.4626 | 10.5745 | 10.6576 | 10.7695 | 10.8526 | 10.9645 | 11.0476 |
| Fibonacci | 10.5792 | 10.6537 | 10.6997 | 10.7742 | 10.8487 | 10.8947 | 10.9692 |
| Pivot points | S3 | S2 | S1 | PP | R1 | R2 | R3 |
|---|---|---|---|---|---|---|---|
| Standard | 10.1391 | 10.4463 | 10.6141 | 10.9213 | 11.0891 | 11.3963 | 11.5641 |
| Camarilla | 10.6514 | 10.6949 | 10.7385 | 10.7820 | 10.8255 | 10.8691 | 10.9126 |
| Woodie | 10.0695 | 10.4115 | 10.5445 | 10.8865 | 11.0195 | 11.3615 | 11.4945 |
| Fibonacci | 10.4463 | 10.6277 | 10.7398 | 10.9213 | 11.1027 | 11.2148 | 11.3963 |
Numerical data
The following are the details of the technical indicators and moving averages that were collected to generate this technical analysis:
| RSI (14): | 48.82 | |
| MACD (12,26,9): | 0.0007 | |
| Directional Movement: | 1.2583 | |
| AROON (14): | -57.1429 | |
| DEMA (21): | 10.7629 | |
| Parabolic SAR (0,02-0,02-0,2): | 10.7888 | |
| Elder Ray (13): | 0.0040 | |
| Super Trend (3,10): | 10.7189 | |
| Zig ZAG (10): | 10.7600 | |
| VORTEX (21): | 1.0373 | |
| Stochastique (14,3,5): | 53.19 | |
| TEMA (21): | 10.7620 | |
| Williams %R (14): | -51.96 | |
| Chande Momentum Oscillator (20): | -0.0124 | |
| Repulse (5,40,3): | 0.0009 | |
| ROCnROLL: | -1 | |
| TRIX (15,9): | 0.0020 | |
| Courbe Coppock: | 0.06 |
| MA7: | 10.7705 | |
| MA20: | 10.8340 | |
| MA50: | 10.9994 | |
| MA100: | 11.1976 | |
| MAexp7: | 10.7619 | |
| MAexp20: | 10.7615 | |
| MAexp50: | 10.7595 | |
| MAexp100: | 10.7653 | |
| Price / MA7: | -0.08% | |
| Price / MA20: | -0.66% | |
| Price / MA50: | -2.16% | |
| Price / MA100: | -3.89% | |
| Price / MAexp7: | +0.00% | |
| Price / MAexp20: | +0.01% | |
| Price / MAexp50: | +0.02% | |
| Price / MAexp100: | -0.03% |
About author
Online


Add a comment
Comments
0 comments on the analysis AUD/MXN - 1H