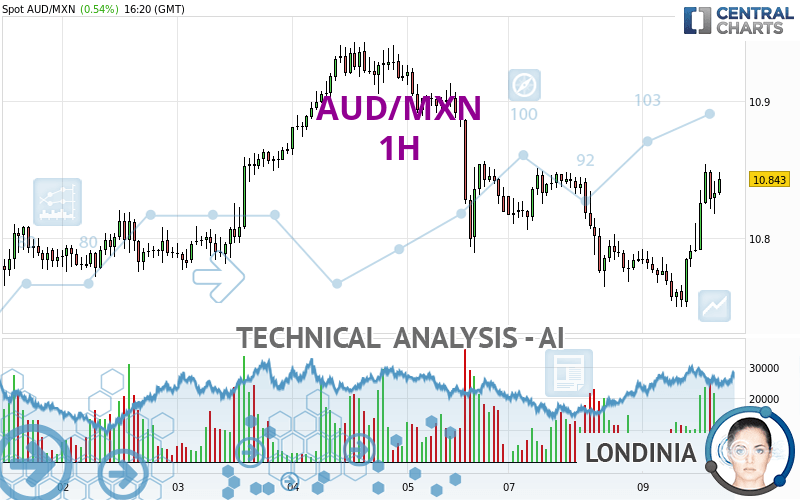
AUD/MXN - 1H - Technical analysis published on 04/09/2024 (GMT)
- 103
- 0
Click here for a new analysis!
- Timeframe : 1H
- - Analysis generated on
- Status : LEVEL MAINTAINED

Summary of the analysis

Additional analysis
Quotes
The AUD/MXN price is 10.8430 MXN. The price registered an increase of +0.54% on the session and was traded between 10.7493 MXN and 10.8540 MXN over the period. The price is currently at +0.87% from its lowest and -0.10% from its highest.A study of price movements over other periods shows the following variations:
Near a new LOW record (5 years)
Type : Bearish
Timeframe : Weekly
Near a new LOW record (1 year)
Type : Bearish
Timeframe : Weekly
New LOW record (1st january)
Type : Bearish
Timeframe : Weekly
Near a new HIGH record (1 month)
Type : Bullish
Timeframe : Weekly
New LOW record (1 month)
Type : Bearish
Timeframe : Weekly
Technical
Technical analysis of this 1H chart of AUD/MXN indicates that the overall trend is slightly bullish. Only 60.71% of the signals given by moving averages are bullish. This slightly bullish trend is reinforced by the strong signals currently being given by short-term moving averages. The Central Indicators market scanner is currently detecting a bearish signal that could impact this trend:
Bearish trend reversal : Moving Average 50
Type : Bearish
Timeframe : 1 hour
The probability of a further increase is high given the direction of the technical indicators.
Caution: the Central Indicators scanner currently detects an excess:
CCI indicator is overbought : over 100
Type : Neutral
Timeframe : 1 hour
Williams %R indicator is overbought : over -20
Type : Neutral
Timeframe : 1 hour
Pivot points : price is over resistance 1
Type : Neutral
Timeframe : 1 hour
Price is back over the pivot point
Type : Bullish
Timeframe : Weekly
Central Patterns, the market scanner focusing on chart patterns, resistances and supports found this result:
Near resistance of channel
Type : Bearish
Timeframe : 1 hour
There is also a Japanese candlestick pattern detected by Central Candlesticks that could mark the end of the current short-term trend:
Doji
Type : Neutral
Timeframe : 1 hour
| S3 | S2 | S1 | Price | R1 | R2 | R3 | |
|---|---|---|---|---|---|---|---|
| ProTrendLines | 10.7220 | 10.7641 | 10.7888 | 10.8430 | 10.8511 | 10.9127 | 10.9429 |
| Change (%) | -1.12% | -0.73% | -0.50% | - | +0.07% | +0.64% | +0.92% |
| Change | -0.1210 | -0.0789 | -0.0542 | - | +0.0081 | +0.0697 | +0.0999 |
| Level | Major | Intermediate | Intermediate | - | Major | Minor | Intermediate |
To determine price objectives, it is also possible to use the pivot points. Here is the price position in relation to pivot points:
| Pivot points | S3 | S2 | S1 | PP | R1 | R2 | R3 |
|---|---|---|---|---|---|---|---|
| Standard | 10.6616 | 10.7126 | 10.7486 | 10.7996 | 10.8356 | 10.8866 | 10.9226 |
| Camarilla | 10.7607 | 10.7687 | 10.7766 | 10.7846 | 10.7926 | 10.8006 | 10.8085 |
| Woodie | 10.6541 | 10.7089 | 10.7411 | 10.7959 | 10.8281 | 10.8829 | 10.9151 |
| Fibonacci | 10.7126 | 10.7458 | 10.7664 | 10.7996 | 10.8328 | 10.8534 | 10.8866 |
| Pivot points | S3 | S2 | S1 | PP | R1 | R2 | R3 |
|---|---|---|---|---|---|---|---|
| Standard | 10.5628 | 10.6637 | 10.7412 | 10.8421 | 10.9196 | 11.0205 | 11.0980 |
| Camarilla | 10.7697 | 10.7861 | 10.8025 | 10.8188 | 10.8352 | 10.8515 | 10.8679 |
| Woodie | 10.5512 | 10.6579 | 10.7296 | 10.8363 | 10.9080 | 11.0147 | 11.0864 |
| Fibonacci | 10.6637 | 10.7318 | 10.7739 | 10.8421 | 10.9102 | 10.9523 | 11.0205 |
| Pivot points | S3 | S2 | S1 | PP | R1 | R2 | R3 |
|---|---|---|---|---|---|---|---|
| Standard | 10.1391 | 10.4463 | 10.6141 | 10.9213 | 11.0891 | 11.3963 | 11.5641 |
| Camarilla | 10.6514 | 10.6949 | 10.7385 | 10.7820 | 10.8255 | 10.8691 | 10.9126 |
| Woodie | 10.0695 | 10.4115 | 10.5445 | 10.8865 | 11.0195 | 11.3615 | 11.4945 |
| Fibonacci | 10.4463 | 10.6277 | 10.7398 | 10.9213 | 11.1027 | 11.2148 | 11.3963 |
Numerical data
The following is the status of technical indicators and moving averages registered at the time this technical analysis was created:
| RSI (14): | 61.58 | |
| MACD (12,26,9): | 0.0063 | |
| Directional Movement: | 12.2022 | |
| AROON (14): | 42.8571 | |
| DEMA (21): | 10.8071 | |
| Parabolic SAR (0,02-0,02-0,2): | 10.7852 | |
| Elder Ray (13): | 0.0268 | |
| Super Trend (3,10): | 10.7756 | |
| Zig ZAG (10): | 10.8384 | |
| VORTEX (21): | 1.1165 | |
| Stochastique (14,3,5): | 80.17 | |
| TEMA (21): | 10.8254 | |
| Williams %R (14): | -9.17 | |
| Chande Momentum Oscillator (20): | 0.0689 | |
| Repulse (5,40,3): | 0.2280 | |
| ROCnROLL: | 1 | |
| TRIX (15,9): | -0.0053 | |
| Courbe Coppock: | 0.79 |
| MA7: | 10.8287 | |
| MA20: | 10.8955 | |
| MA50: | 11.0421 | |
| MA100: | 11.2229 | |
| MAexp7: | 10.8220 | |
| MAexp20: | 10.8033 | |
| MAexp50: | 10.8128 | |
| MAexp100: | 10.8257 | |
| Price / MA7: | +0.13% | |
| Price / MA20: | -0.48% | |
| Price / MA50: | -1.80% | |
| Price / MA100: | -3.39% | |
| Price / MAexp7: | +0.19% | |
| Price / MAexp20: | +0.37% | |
| Price / MAexp50: | +0.28% | |
| Price / MAexp100: | +0.16% |
About author
Online


Add a comment
Comments
0 comments on the analysis AUD/MXN - 1H