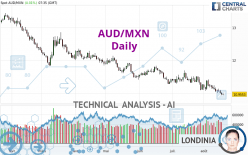
AUD/MXN - Daily - Technical analysis published on 08/18/2023 (GMT)
- 113
- 0
Click here for a new analysis!
- Timeframe : Daily
- - Analysis generated on
- Status : INVALID

Summary of the analysis

Additional analysis
Quotes
AUD/MXN rating 10.9537 MXN. The price registered a decrease of -0.01% on the session and was traded between 10.9296 MXN and 10.9838 MXN over the period. The price is currently at +0.22% from its lowest and -0.27% from its highest.A bullish opening was detected by the Central Gaps scanner. Buyers are trying to impose a bullish momentum in the very short term.
Bullish opening
Type : Bullish
Timeframe : Openning
So that you have an overall view of the price change, here is a table showing the variations over several periods:
New LOW record (5 years)
Type : Bearish
Timeframe : Weekly
New LOW record (1 year)
Type : Bearish
Timeframe : Weekly
New LOW record (1st january)
Type : Bearish
Timeframe : Weekly
Near a new HIGH record (1 month)
Type : Bullish
Timeframe : Weekly
New LOW record (1 month)
Type : Bearish
Timeframe : Weekly
Technical
Technical analysis of this Daily chart of AUD/MXN indicates that the overall trend is strongly bearish. The signals given by moving averages are 92.86% bearish. This strong bearish trend is confirmed by the strong signals currently being given by short-term moving averages. The Central Indicators market scanner currently does not detect any result that concerns moving averages.
In fact, 13 technical indicators on 18 studied are currently positioned bearish. Caution: the Central Indicators scanner currently detects an excess:
CCI indicator is oversold : under -100
Type : Neutral
Timeframe : Daily
CCI indicator: bullish divergence
Type : Bullish
Timeframe : Daily
Williams %R indicator is oversold : under -80
Type : Neutral
Timeframe : Daily
An analysis of the price chart with the Central Patterns scanner (detector of chart patterns and resistances and supports) shows a result that can have an impact on the price change:
Near support of channel
Type : Bullish
Timeframe : Daily
From the Japanese candlestick perspective, the Central Candlesticks scanner notes the presence of these results that could impact the short-term trend:
Bullish harami
Type : Bullish
Timeframe : Daily
Doji
Type : Neutral
Timeframe : Daily
| S2 | S1 | Price | R1 | R2 | R3 | |
|---|---|---|---|---|---|---|
| ProTrendLines | 8.1752 | 10.1474 | 10.9537 | 11.2833 | 12.0639 | 12.3919 |
| Change (%) | -25.37% | -7.36% | - | +3.01% | +10.14% | +13.13% |
| Change | -2.7785 | -0.8063 | - | +0.3296 | +1.1102 | +1.4382 |
| Level | Minor | Intermediate | - | Major | Intermediate | Major |
Pivot points can also be used to set your price objectives. Here is the price situation in relation to pivot points:
| Pivot points | S3 | S2 | S1 | PP | R1 | R2 | R3 |
|---|---|---|---|---|---|---|---|
| Standard | 10.8236 | 10.8771 | 10.9158 | 10.9693 | 11.0080 | 11.0615 | 11.1002 |
| Camarilla | 10.9292 | 10.9376 | 10.9461 | 10.9545 | 10.9630 | 10.9714 | 10.9799 |
| Woodie | 10.8162 | 10.8734 | 10.9084 | 10.9656 | 11.0006 | 11.0578 | 11.0928 |
| Fibonacci | 10.8771 | 10.9123 | 10.9341 | 10.9693 | 11.0045 | 11.0263 | 11.0615 |
| Pivot points | S3 | S2 | S1 | PP | R1 | R2 | R3 |
|---|---|---|---|---|---|---|---|
| Standard | 10.7273 | 10.8756 | 10.9632 | 11.1115 | 11.1991 | 11.3474 | 11.4350 |
| Camarilla | 10.9859 | 11.0076 | 11.0292 | 11.0508 | 11.0724 | 11.0941 | 11.1157 |
| Woodie | 10.6970 | 10.8604 | 10.9329 | 11.0963 | 11.1688 | 11.3322 | 11.4047 |
| Fibonacci | 10.8756 | 10.9657 | 11.0214 | 11.1115 | 11.2016 | 11.2573 | 11.3474 |
| Pivot points | S3 | S2 | S1 | PP | R1 | R2 | R3 |
|---|---|---|---|---|---|---|---|
| Standard | 10.3894 | 10.7355 | 10.9938 | 11.3399 | 11.5982 | 11.9443 | 12.2026 |
| Camarilla | 11.0858 | 11.1412 | 11.1966 | 11.2520 | 11.3074 | 11.3628 | 11.4182 |
| Woodie | 10.3454 | 10.7136 | 10.9498 | 11.3180 | 11.5542 | 11.9224 | 12.1586 |
| Fibonacci | 10.7355 | 10.9664 | 11.1091 | 11.3399 | 11.5708 | 11.7135 | 11.9443 |
Numerical data
The following is the status of technical indicators and moving averages registered at the time this technical analysis was created:
| RSI (14): | 36.03 | |
| MACD (12,26,9): | -0.1139 | |
| Directional Movement: | -9.4333 | |
| AROON (14): | -71.4286 | |
| DEMA (21): | 11.0118 | |
| Parabolic SAR (0,02-0,02-0,2): | 11.1550 | |
| Elder Ray (13): | -0.1390 | |
| Super Trend (3,10): | 11.3412 | |
| Zig ZAG (10): | 10.9543 | |
| VORTEX (21): | 0.8765 | |
| Stochastique (14,3,5): | 5.81 | |
| TEMA (21): | 10.9746 | |
| Williams %R (14): | -94.89 | |
| Chande Momentum Oscillator (20): | -0.1758 | |
| Repulse (5,40,3): | -0.9564 | |
| ROCnROLL: | 2 | |
| TRIX (15,9): | -0.1206 | |
| Courbe Coppock: | 4.54 |
| MA7: | 11.0303 | |
| MA20: | 11.1782 | |
| MA50: | 11.3685 | |
| MA100: | 11.6258 | |
| MAexp7: | 11.0314 | |
| MAexp20: | 11.1566 | |
| MAexp50: | 11.3469 | |
| MAexp100: | 11.6263 | |
| Price / MA7: | -0.69% | |
| Price / MA20: | -2.01% | |
| Price / MA50: | -3.65% | |
| Price / MA100: | -5.78% | |
| Price / MAexp7: | -0.69% | |
| Price / MAexp20: | -1.80% | |
| Price / MAexp50: | -3.45% | |
| Price / MAexp100: | -5.77% |
About author
Online


Add a comment
Comments
0 comments on the analysis AUD/MXN - Daily