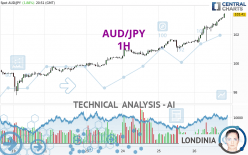
AUD/JPY - 1H - Technical analysis published on 04/26/2024 (GMT)
- 102
- 0
Click here for a new analysis!
- Timeframe : 1H
- - Analysis generated on
- Status : INVALID

Summary of the analysis

Additional analysis
Quotes
The AUD/JPY rating is 103.41 JPY. The price registered an increase of +1.88% on the session and was traded between 101.41 JPY and 103.48 JPY over the period. The price is currently at +1.97% from its lowest and -0.07% from its highest.A study of price movements over other periods shows the following variations:
New HIGH record (5 years)
Type : Bullish
Timeframe : Weekly
New HIGH record (1 year)
Type : Bullish
Timeframe : Weekly
New HIGH record (1st january)
Type : Bullish
Timeframe : Weekly
New HIGH record (1 month)
Type : Bullish
Timeframe : Weekly
Technical
A technical analysis in 1H of this AUD/JPY chart shows a strongly bullish trend. The signals given by the moving averages are 92.86% bullish. This strong bullish trend is confirmed by the strong signals currently being given by short-term moving averages. The Central Indicators market scanner currently does not detect any result that concerns moving averages.
In fact, 16 technical indicators on 18 studied are currently bullish. But beware of excesses. The Central Indicators scanner currently detects this:
RSI indicator is overbought : over 80
Type : Neutral
Timeframe : 1 hour
CCI indicator is overbought : over 100
Type : Neutral
Timeframe : 1 hour
Williams %R indicator is overbought : over -20
Type : Neutral
Timeframe : 1 hour
Pivot points : price is over resistance 3
Type : Neutral
Timeframe : 1 hour
Pivot points : price is over resistance 3
Type : Neutral
Timeframe : Weekly
Central Patterns, the market scanner focusing on chart patterns, resistances and supports found these results:
Near horizontal resistance
Type : Bearish
Timeframe : 1 hour
Resistance of channel is broken
Type : Bullish
Timeframe : 1 hour
No result was found by the Central Candlesticks scanner on Japanese candlesticks.
| S3 | S2 | S1 | Price | R1 | |
|---|---|---|---|---|---|
| ProTrendLines | 99.58 | 100.60 | 101.66 | 103.41 | 105.04 |
| Change (%) | -3.70% | -2.72% | -1.69% | - | +1.58% |
| Change | -3.83 | -2.81 | -1.75 | - | +1.63 |
| Level | Major | Intermediate | Intermediate | - | Intermediate |
To determine price objectives, it is also possible to use the pivot points. Here is the price position in relation to pivot points:
| Pivot points | S3 | S2 | S1 | PP | R1 | R2 | R3 |
|---|---|---|---|---|---|---|---|
| Standard | 100.10 | 100.45 | 100.97 | 101.32 | 101.84 | 102.19 | 102.71 |
| Camarilla | 101.26 | 101.34 | 101.42 | 101.50 | 101.58 | 101.66 | 101.74 |
| Woodie | 100.20 | 100.49 | 101.07 | 101.36 | 101.94 | 102.23 | 102.81 |
| Fibonacci | 100.45 | 100.78 | 100.98 | 101.32 | 101.65 | 101.85 | 102.19 |
| Pivot points | S3 | S2 | S1 | PP | R1 | R2 | R3 |
|---|---|---|---|---|---|---|---|
| Standard | 95.76 | 96.77 | 98.00 | 99.01 | 100.24 | 101.25 | 102.48 |
| Camarilla | 98.61 | 98.82 | 99.03 | 99.23 | 99.44 | 99.64 | 99.85 |
| Woodie | 95.87 | 96.83 | 98.11 | 99.07 | 100.35 | 101.31 | 102.59 |
| Fibonacci | 96.77 | 97.63 | 98.15 | 99.01 | 99.87 | 100.39 | 101.25 |
| Pivot points | S3 | S2 | S1 | PP | R1 | R2 | R3 |
|---|---|---|---|---|---|---|---|
| Standard | 93.62 | 95.26 | 96.91 | 98.55 | 100.20 | 101.84 | 103.49 |
| Camarilla | 97.66 | 97.96 | 98.26 | 98.56 | 98.86 | 99.16 | 99.47 |
| Woodie | 93.63 | 95.26 | 96.92 | 98.55 | 100.21 | 101.84 | 103.50 |
| Fibonacci | 95.26 | 96.52 | 97.29 | 98.55 | 99.81 | 100.58 | 101.84 |
Numerical data
The following is the status of technical indicators and moving averages registered at the time this technical analysis was created:
| RSI (14): | 86.81 | |
| MACD (12,26,9): | 0.4400 | |
| Directional Movement: | 18.37 | |
| AROON (14): | 85.71 | |
| DEMA (21): | 103.14 | |
| Parabolic SAR (0,02-0,02-0,2): | 102.24 | |
| Elder Ray (13): | 0.51 | |
| Super Trend (3,10): | 102.60 | |
| Zig ZAG (10): | 103.37 | |
| VORTEX (21): | 1.2900 | |
| Stochastique (14,3,5): | 97.87 | |
| TEMA (21): | 103.30 | |
| Williams %R (14): | -5.15 | |
| Chande Momentum Oscillator (20): | 0.87 | |
| Repulse (5,40,3): | 0.4000 | |
| ROCnROLL: | 1 | |
| TRIX (15,9): | 0.0600 | |
| Courbe Coppock: | 1.95 |
| MA7: | 100.64 | |
| MA20: | 99.90 | |
| MA50: | 98.91 | |
| MA100: | 97.84 | |
| MAexp7: | 103.04 | |
| MAexp20: | 102.56 | |
| MAexp50: | 101.90 | |
| MAexp100: | 101.24 | |
| Price / MA7: | +2.75% | |
| Price / MA20: | +3.51% | |
| Price / MA50: | +4.55% | |
| Price / MA100: | +5.69% | |
| Price / MAexp7: | +0.36% | |
| Price / MAexp20: | +0.83% | |
| Price / MAexp50: | +1.48% | |
| Price / MAexp100: | +2.14% |
News
The last news published on AUD/JPY at the time of the generation of this analysis was as follows:
-
 AUD/JPY Forecast January 6, 2023
-
AUD/JPY Forecast December 16, 2022
-
Risk event for the week: Long #AUDJPY
-
Trade of the Week: long AUD/JPY
-
Market Sentiment Webinar: Positive for USD, Bullish Signal on AUD/JPY
About author

Online


Add a comment
Comments
0 comments on the analysis AUD/JPY - 1H