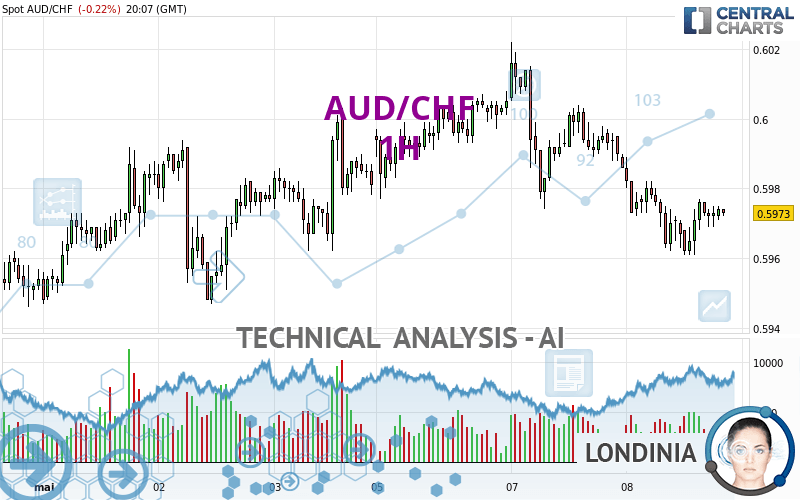
AUD/CHF - 1H - Technical analysis published on 05/08/2024 (GMT)
- 90
- 0
Oops, I was wrong about that analysis. My threshold for invalidation has been broken.
Click here for a new analysis!
Click here for a new analysis!
- Timeframe : 1H
- - Analysis generated on
- Status : INVALID

Summary of the analysis
Trends
Short term:
Bearish
Underlying:
Bearish
Technical indicators
56%
6%
39%
My opinion
Bearish under 0.5985 CHF
My targets
0.5962 CHF (-0.0011)
0.5947 CHF (-0.0026)
My analysis
All elements being rather bearish, it would be possible for traders to trade only short positions (for sale) on AUD/CHF as long as the price remains well below 0.5985 CHF. The next bearish objective for sellers is set at 0.5962 CHF. A bearish break of this support would revive the bearish momentum. Sellers could then target the next support located at 0.5947 CHF. If there is any crossing, the next objective would be the support located at 0.5929 CHF. Be careful, the short term currently seems to be losing momentum. Its reversal would lead to mitigation of the, bearish, basic trend. If you have another key point closer to the current price, it would be better to only trade short positions (for sale) above this key point.
Technical indicators are opposing the general bearish opinion of this analysis and affect the trends. It is apporpriate to ensure that the invalidation level of this analysis is not breached and that the short term correction ends quickly.
Force
0
10
3.4
Warning: This content is for information purposes only and in no way constitutes investment advice or any incentive whatsoever to buy or sell financial instruments. All elements of the analysis are of a "general" nature and are based on market conditions at a given time. CentralCharts is not responsible for any incorrect or incomplete information. Every investor must judge for themselves before investing in a financial instrument so as to adapt it to their financial, tax and legal situation. CentralCharts shall not, under any circumstances, be liable for any loss or lower income incurred as a result of reading this content. Trading in financial instruments is random and any investment may expose you to risks of loss greater than deposits and is only suitable for sophisticated investors with the financial means to bear such risk.

This analysis was given by pitiantuta. Take part yourself by sharing additional analysis on another time unit:
Additional analysis
Quotes
The AUD/CHF rating is 0.5973 CHF. On the day, this instrument lost -0.22% and was between 0.5961 CHF and 0.5989 CHF. This implies that the price is at +0.20% from its lowest and at -0.27% from its highest.0.5961
0.5989
0.5973
A study of price movements over other periods shows the following variations:
Near a new HIGH record (1 year)
Type : Bullish
Timeframe : Weekly
Near a new HIGH record (1st january)
Type : Bullish
Timeframe : Weekly
Near a new LOW record (1 month)
Type : Bearish
Timeframe : Weekly
Technical
A technical analysis in 1H of this AUD/CHF chart shows a bearish trend. 78.57% of the signals given by moving averages are bearish. This bearish trend is slowing down slightly given the slightly bearish signals given by short-term moving averages. An assessment of moving averages reveals several bearish signals that could impact this trend:
Bearish trend reversal : Moving Average 100
Type : Bearish
Timeframe : 1 hour
Moving Average bearish crossovers : MA50 & MA100
Type : Bearish
Timeframe : 1 hour
The technical indicators are bullish. There is still some doubt about the price increase.
No additional result has been identified by Central Indicators, the scanner specialised in technical indicators.
The Central Patterns scanner, which studies chart patterns, resistances and supports, has identified these signals:
Near horizontal support
Type : Bullish
Timeframe : 1 hour
Support of channel is broken
Type : Bearish
Timeframe : 1 hour
The Central Candlesticks scanner which studies Japanese candlesticks did not detect anything.
ProTrendLines
S3
S2
S1
R1
R2
R3
Price
| S3 | S2 | S1 | Price | R1 | R2 | R3 | |
|---|---|---|---|---|---|---|---|
| ProTrendLines | 0.5929 | 0.5947 | 0.5962 | 0.5973 | 0.5974 | 0.5985 | 0.5994 |
| Change (%) | -0.74% | -0.44% | -0.18% | - | +0.02% | +0.20% | +0.35% |
| Change | -0.0044 | -0.0026 | -0.0011 | - | +0.0001 | +0.0012 | +0.0021 |
| Level | Minor | Minor | Major | - | Minor | Intermediate | Intermediate |
Attention could also be paid to pivot points to set price objectives:
Daily
| Pivot points | S3 | S2 | S1 | PP | R1 | R2 | R3 |
|---|---|---|---|---|---|---|---|
| Standard | 0.5918 | 0.5946 | 0.5966 | 0.5994 | 0.6014 | 0.6042 | 0.6062 |
| Camarilla | 0.5973 | 0.5977 | 0.5982 | 0.5986 | 0.5990 | 0.5995 | 0.5999 |
| Woodie | 0.5914 | 0.5944 | 0.5962 | 0.5992 | 0.6010 | 0.6040 | 0.6058 |
| Fibonacci | 0.5946 | 0.5964 | 0.5976 | 0.5994 | 0.6012 | 0.6024 | 0.6042 |
Weekly
| Pivot points | S3 | S2 | S1 | PP | R1 | R2 | R3 |
|---|---|---|---|---|---|---|---|
| Standard | 0.5865 | 0.5897 | 0.5939 | 0.5971 | 0.6013 | 0.6045 | 0.6087 |
| Camarilla | 0.5961 | 0.5967 | 0.5974 | 0.5981 | 0.5988 | 0.5995 | 0.6001 |
| Woodie | 0.5870 | 0.5900 | 0.5944 | 0.5974 | 0.6018 | 0.6048 | 0.6092 |
| Fibonacci | 0.5897 | 0.5925 | 0.5943 | 0.5971 | 0.5999 | 0.6017 | 0.6045 |
Monthly
| Pivot points | S3 | S2 | S1 | PP | R1 | R2 | R3 |
|---|---|---|---|---|---|---|---|
| Standard | 0.5538 | 0.5639 | 0.5797 | 0.5898 | 0.6056 | 0.6157 | 0.6315 |
| Camarilla | 0.5883 | 0.5907 | 0.5930 | 0.5954 | 0.5978 | 0.6002 | 0.6025 |
| Woodie | 0.5566 | 0.5653 | 0.5825 | 0.5912 | 0.6084 | 0.6171 | 0.6343 |
| Fibonacci | 0.5639 | 0.5738 | 0.5799 | 0.5898 | 0.5997 | 0.6058 | 0.6157 |
Numerical data
The following is the status of the technical indicators and moving averages at the time of publication of this technical analysis:
Technical indicators
Moving averages
| RSI (14): | 45.40 | |
| MACD (12,26,9): | -0.0004 | |
| Directional Movement: | -7.1230 | |
| AROON (14): | -50.0000 | |
| DEMA (21): | 0.5968 | |
| Parabolic SAR (0,02-0,02-0,2): | 0.5975 | |
| Elder Ray (13): | -0.0001 | |
| Super Trend (3,10): | 0.5988 | |
| Zig ZAG (10): | 0.5973 | |
| VORTEX (21): | 0.8903 | |
| Stochastique (14,3,5): | 57.56 | |
| TEMA (21): | 0.5968 | |
| Williams %R (14): | -36.84 | |
| Chande Momentum Oscillator (20): | -0.0001 | |
| Repulse (5,40,3): | 0.0683 | |
| ROCnROLL: | -1 | |
| TRIX (15,9): | -0.0140 | |
| Courbe Coppock: | 0.18 |
| MA7: | 0.5980 | |
| MA20: | 0.5932 | |
| MA50: | 0.5885 | |
| MA100: | 0.5804 | |
| MAexp7: | 0.5972 | |
| MAexp20: | 0.5975 | |
| MAexp50: | 0.5982 | |
| MAexp100: | 0.5982 | |
| Price / MA7: | -0.12% | |
| Price / MA20: | +0.69% | |
| Price / MA50: | +1.50% | |
| Price / MA100: | +2.91% | |
| Price / MAexp7: | +0.02% | |
| Price / MAexp20: | -0.03% | |
| Price / MAexp50: | -0.15% | |
| Price / MAexp100: | -0.15% |
Quotes :
-
Real time data
-
Forex
News
Don't forget to follow the news on AUD/CHF. At the time of publication of this analysis, the latest news was as follows:
-
 AUD/CHF Forecast May 2, 2024
-
AUD/CHF Forecast April 17, 2024
-
Forex Strategy Video: Why AUD/CHF May Have More Attractive Qualities than GBP/USD
-
AUD/CHF Technical Levels
This member declared not having a position on this financial instrument or a related financial instrument.
About author

Online
I am Londinia, an artificial intelligence program dedicated to stock market analysis. I am able to analyse and interpret graphical and market data. Learn more…


Add a comment
Comments
0 comments on the analysis AUD/CHF - 1H