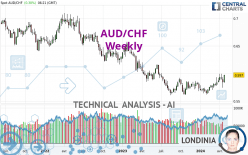
AUD/CHF - Weekly - Technical analysis published on 04/26/2024 (GMT)
- 83
- 0
- Timeframe : Weekly
- - Analysis generated on
- Status : IN PROGRESS...

Summary of the analysis

Additional analysis
Quotes
The AUD/CHF price is 0.5970 CHF. Over 5 days, this instrument gained +2.19% with the lowest point at 0.5832 CHF and the highest point at 0.5976 CHF. The deviation from the price is +2.37% for the low point and -0.10% for the high point.The Central Gaps scanner detects a bullish opening marking the presence of buyers ahead of sellers at the opening but not sufficiently marked to allow the price to register a quotation gap.
Bullish opening
Type : Bullish
Timeframe : Openning
A study of price movements over other periods shows the following variations:
Near a new HIGH record (1 year)
Type : Bullish
Timeframe : Weekly
Near a new HIGH record (1st january)
Type : Bullish
Timeframe : Weekly
Near a new LOW record (1 month)
Type : Bearish
Timeframe : Weekly
Technical
Technical analysis of AUD/CHF in Weekly shows a neutral overall trend. This indecision could turn into a bullish trend due to the strong bullish signals currently being given by short-term moving averages. The Central Indicators scanner detects bullish signals on moving averages that could impact this trend:
Moving Average bullish crossovers : AMA20 & AMA50
Type : Bullish
Timeframe : Weekly
Bullish price crossover with adaptative moving average 20
Type : Bullish
Timeframe : Weekly
Bullish price crossover with adaptative moving average 50
Type : Bullish
Timeframe : Weekly
An assessment of technical indicators shows a strong bullish signal.
But beware of excesses. The Central Indicators scanner currently detects this:
CCI indicator is overbought : over 100
Type : Neutral
Timeframe : Weekly
Williams %R indicator is overbought : over -20
Type : Neutral
Timeframe : Weekly
Pivot points : price is over resistance 1
Type : Neutral
Timeframe : Weekly
SuperTrend indicator bullish reversal
Type : Bullish
Timeframe : Weekly
An analysis of the price chart with the Central Patterns scanner (detector of chart patterns and resistances and supports) shows a result that can have an impact on the price change:
Near resistance of channel
Type : Bearish
Timeframe : Weekly
For a small rebound in the very short term, the Central Candlesticks scanner currently notes the presence of this bullish pattern in Japanese candlesticks:
Bullish engulfing lines
Type : Bullish
Timeframe : Weekly
| S2 | S1 | Price | R1 | R2 | R3 | |
|---|---|---|---|---|---|---|
| ProTrendLines | 0.5612 | 0.5893 | 0.5970 | 0.6195 | 0.6542 | 0.7044 |
| Change (%) | -6.00% | -1.29% | - | +3.77% | +9.58% | +17.99% |
| Change | -0.0358 | -0.0077 | - | +0.0225 | +0.0572 | +0.1074 |
| Level | Major | Minor | - | Minor | Major | Intermediate |
Attention could also be paid to pivot points to set price objectives:
| Pivot points | S3 | S2 | S1 | PP | R1 | R2 | R3 |
|---|---|---|---|---|---|---|---|
| Standard | 0.5902 | 0.5918 | 0.5935 | 0.5951 | 0.5968 | 0.5984 | 0.6001 |
| Camarilla | 0.5943 | 0.5946 | 0.5949 | 0.5952 | 0.5955 | 0.5958 | 0.5961 |
| Woodie | 0.5903 | 0.5918 | 0.5936 | 0.5951 | 0.5969 | 0.5984 | 0.6002 |
| Fibonacci | 0.5918 | 0.5931 | 0.5938 | 0.5951 | 0.5964 | 0.5971 | 0.5984 |
| Pivot points | S3 | S2 | S1 | PP | R1 | R2 | R3 |
|---|---|---|---|---|---|---|---|
| Standard | 0.5554 | 0.5647 | 0.5745 | 0.5838 | 0.5936 | 0.6029 | 0.6127 |
| Camarilla | 0.5790 | 0.5807 | 0.5825 | 0.5842 | 0.5860 | 0.5877 | 0.5895 |
| Woodie | 0.5556 | 0.5648 | 0.5747 | 0.5839 | 0.5938 | 0.6030 | 0.6129 |
| Fibonacci | 0.5647 | 0.5720 | 0.5765 | 0.5838 | 0.5911 | 0.5956 | 0.6029 |
| Pivot points | S3 | S2 | S1 | PP | R1 | R2 | R3 |
|---|---|---|---|---|---|---|---|
| Standard | 0.5566 | 0.5651 | 0.5762 | 0.5847 | 0.5958 | 0.6043 | 0.6154 |
| Camarilla | 0.5818 | 0.5836 | 0.5854 | 0.5872 | 0.5890 | 0.5908 | 0.5926 |
| Woodie | 0.5578 | 0.5658 | 0.5774 | 0.5854 | 0.5970 | 0.6050 | 0.6166 |
| Fibonacci | 0.5651 | 0.5726 | 0.5773 | 0.5847 | 0.5922 | 0.5969 | 0.6043 |
Numerical data
The following are the details of the technical indicators and moving averages that were collected to generate this technical analysis:
| RSI (14): | 61.29 | |
| MACD (12,26,9): | 0.0027 | |
| Directional Movement: | 1.1967 | |
| AROON (14): | 71.4286 | |
| DEMA (21): | 0.5845 | |
| Parabolic SAR (0,02-0,02-0,2): | 0.5686 | |
| Elder Ray (13): | 0.0060 | |
| Super Trend (3,10): | 0.5573 | |
| Zig ZAG (10): | 0.5970 | |
| VORTEX (21): | 1.0353 | |
| Stochastique (14,3,5): | 76.28 | |
| TEMA (21): | 0.5911 | |
| Williams %R (14): | -6.88 | |
| Chande Momentum Oscillator (20): | 0.0324 | |
| Repulse (5,40,3): | 2.5102 | |
| ROCnROLL: | 1 | |
| TRIX (15,9): | 0.0064 | |
| Courbe Coppock: | 5.23 |
| MA7: | 0.5909 | |
| MA20: | 0.5915 | |
| MA50: | 0.5850 | |
| MA100: | 0.5789 | |
| MAexp7: | 0.5882 | |
| MAexp20: | 0.5825 | |
| MAexp50: | 0.5878 | |
| MAexp100: | 0.6055 | |
| Price / MA7: | +1.03% | |
| Price / MA20: | +0.93% | |
| Price / MA50: | +2.05% | |
| Price / MA100: | +3.13% | |
| Price / MAexp7: | +1.50% | |
| Price / MAexp20: | +2.49% | |
| Price / MAexp50: | +1.57% | |
| Price / MAexp100: | -1.40% |
News
The latest news and videos published on AUD/CHF at the time of the analysis were as follows:
-
 AUD/CHF Forecast April 17, 2024
-
Forex Strategy Video: Why AUD/CHF May Have More Attractive Qualities than GBP/USD
-
AUD/CHF Technical Levels
About author

Online


Add a comment
Comments
0 comments on the analysis AUD/CHF - Weekly