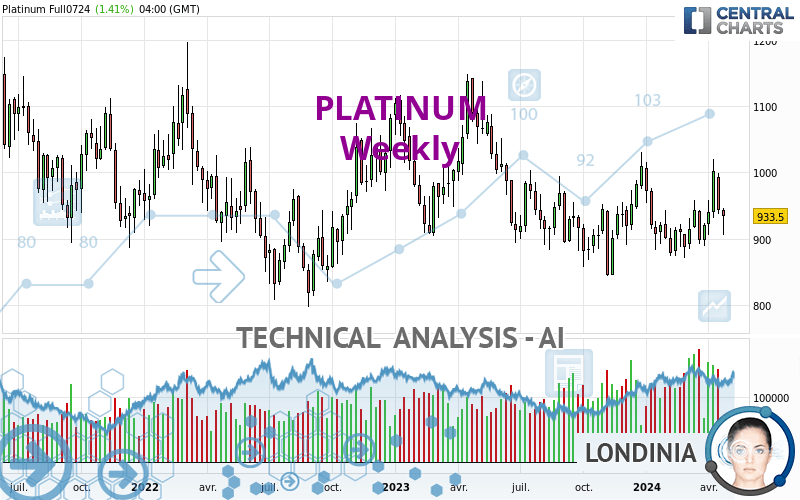
PLATINUM - Weekly - Technical analysis published on 04/26/2024 (GMT)
- 69
- 0
- Timeframe : Weekly
- - Analysis generated on
- Status : IN PROGRESS...

Only Londinia subscribers can view the key levels of this analysis. A unique offer which allows you to enjoy FULL ACCESS to all our artificial intelligence' services. Discover Londinia...
Summary of the analysis
Trends
Short term:
Strongly bearish
Underlying:
Strongly bearish
Technical indicators
39%
17%
44%
My opinion
Bearish under
My targets
()
()
My analysis
All elements being clearly bearish, it would be possible for traders to trade only short positions (for sale) on PLATINUM as long as the price remains well below . The sellers' bearish objective is set at . A bearish break of this support would revive the bearish momentum. The sellers could then target the support located at . In case of crossing, the next objective would be the support located at . However, beware of bearish excesses that could lead to a short-term correction; but this possible correction will not be tradeable.
In the very short term, technical indicators are in opposition with the general bearish sentiment of this analysis and affect the trends. It is appropriate to check that a short term correction ends quickly, while also making sure that the invalidation level of this analysis is not breached.
Force
0
10
5.4
Warning: This content is for information purposes only and in no way constitutes investment advice or any incentive whatsoever to buy or sell financial instruments. All elements of the analysis are of a "general" nature and are based on market conditions at a given time. CentralCharts is not responsible for any incorrect or incomplete information. Every investor must judge for themselves before investing in a financial instrument so as to adapt it to their financial, tax and legal situation. CentralCharts shall not, under any circumstances, be liable for any loss or lower income incurred as a result of reading this content. Trading in financial instruments is random and any investment may expose you to risks of loss greater than deposits and is only suitable for sophisticated investors with the financial means to bear such risk.

This analysis was given by Muhahaha. Take part yourself by sharing additional analysis on another time unit:
Additional analysis
Quotes
The PLATINUM price is 933.50 USD. Over 5 days, this instrument lost -1.09% and was traded between 905.50 USD and 946.90 USD over the period. The price is currently at +3.09% from its lowest point and -1.42% from its highest point.905.50
946.90
933.50
The Central Gaps scanner detects a bullish opening marking the presence of buyers ahead of sellers at the opening but not sufficiently marked to allow the price to register a quotation gap.
Bullish opening
Type : Bullish
Timeframe : Openning
So that you have an overall view of the price change, here is a table showing the variations over several periods:
Near a new LOW record (1st january)
Type : Bearish
Timeframe : Weekly
Near a new LOW record (1 month)
Type : Bearish
Timeframe : Weekly
Technical
Technical analysis of PLATINUM in Weekly shows a overall strongly bearish trend. 92.86% of the signals given by moving averages are bearish. This strongly bearish trend is supported by the strong bearish signals given by short-term moving averages. An assessment of moving averages reveals several bearish signals that could impact this trend:
Bearish trend reversal : Moving Average 20
Type : Bearish
Timeframe : Weekly
Bearish trend reversal : adaptative moving average 20
Type : Bearish
Timeframe : Weekly
In fact, according to the parameters integrated into the Central Analyzer system, only 7 technical indicators out of 18 analysed are currently bullish. No additional result has been identified by Central Indicators, the scanner specialised in technical indicators.
The analysis of the price chart with Central Patterns scanners does not return any result.
Central Candlesticks, the scanner specialised in Japanese candlesticks, detects this inversion signal that could impact the current short-term trend:
Black hanging man / hammer
Type : Neutral
Timeframe : Weekly
ProTrendLines
S2
S1
R1
R2
R3
Price
| S2 | S1 | Price | R1 | R2 | R3 | |
|---|---|---|---|---|---|---|
| ProTrendLines | 694.29 | 861.12 | 933.50 | 962.06 | 1,049.93 | 1,190.73 |
| Change (%) | -25.63% | -7.75% | - | +3.06% | +12.47% | +27.56% |
| Change | -239.21 | -72.38 | - | +28.56 | +116.43 | +257.23 |
| Level | Minor | Major | - | Major | Intermediate | Major |
Attention could also be paid to pivot points to set price objectives:
Daily
| Pivot points | S3 | S2 | S1 | PP | R1 | R2 | R3 |
|---|---|---|---|---|---|---|---|
| Standard | 886.57 | 896.03 | 908.27 | 917.73 | 929.97 | 939.43 | 951.67 |
| Camarilla | 914.53 | 916.52 | 918.51 | 920.50 | 922.49 | 924.48 | 926.47 |
| Woodie | 887.95 | 896.73 | 909.65 | 918.43 | 931.35 | 940.13 | 953.05 |
| Fibonacci | 896.03 | 904.32 | 909.44 | 917.73 | 926.02 | 931.14 | 939.43 |
Weekly
| Pivot points | S3 | S2 | S1 | PP | R1 | R2 | R3 |
|---|---|---|---|---|---|---|---|
| Standard | 858.43 | 897.47 | 920.63 | 959.67 | 982.83 | 1,021.87 | 1,045.03 |
| Camarilla | 926.70 | 932.40 | 938.10 | 943.80 | 949.50 | 955.20 | 960.91 |
| Woodie | 850.50 | 893.50 | 912.70 | 955.70 | 974.90 | 1,017.90 | 1,037.10 |
| Fibonacci | 897.47 | 921.23 | 935.91 | 959.67 | 983.43 | 998.11 | 1,021.87 |
Monthly
| Pivot points | S3 | S2 | S1 | PP | R1 | R2 | R3 |
|---|---|---|---|---|---|---|---|
| Standard | 807.33 | 853.07 | 882.23 | 927.97 | 957.13 | 1,002.87 | 1,032.03 |
| Camarilla | 890.80 | 897.67 | 904.53 | 911.40 | 918.27 | 925.13 | 932.00 |
| Woodie | 799.05 | 848.93 | 873.95 | 923.83 | 948.85 | 998.73 | 1,023.75 |
| Fibonacci | 853.07 | 881.68 | 899.36 | 927.97 | 956.58 | 974.26 | 1,002.87 |
Numerical data
The following are the details of the technical indicators and moving averages that were collected to generate this technical analysis:
Technical indicators
Moving averages
| RSI (14): | 48.03 | |
| MACD (12,26,9): | -5.1900 | |
| Directional Movement: | 3.25 | |
| AROON (14): | 42.85 | |
| DEMA (21): | 933.38 | |
| Parabolic SAR (0,02-0,02-0,2): | 890.27 | |
| Elder Ray (13): | -14.96 | |
| Super Trend (3,10): | 1,043.77 | |
| Zig ZAG (10): | 931.80 | |
| VORTEX (21): | 0.9600 | |
| Stochastique (14,3,5): | 54.60 | |
| TEMA (21): | 941.33 | |
| Williams %R (14): | -65.27 | |
| Chande Momentum Oscillator (20): | 15.60 | |
| Repulse (5,40,3): | -0.6800 | |
| ROCnROLL: | 2 | |
| TRIX (15,9): | -0.1400 | |
| Courbe Coppock: | 1.89 |
| MA7: | 931.63 | |
| MA20: | 952.10 | |
| MA50: | 935.02 | |
| MA100: | 943.03 | |
| MAexp7: | 943.27 | |
| MAexp20: | 942.95 | |
| MAexp50: | 963.33 | |
| MAexp100: | 987.63 | |
| Price / MA7: | +0.20% | |
| Price / MA20: | -1.95% | |
| Price / MA50: | -0.16% | |
| Price / MA100: | -1.01% | |
| Price / MAexp7: | -1.04% | |
| Price / MAexp20: | -1.00% | |
| Price / MAexp50: | -3.10% | |
| Price / MAexp100: | -5.48% |
Quotes :
-
10 min delayed data
-
NYMEX Futures
News
Don't forget to follow the news on PLATINUM. At the time of publication of this analysis, the latest news was as follows:
-
 Sylvania Platinum - executive interview
-
Queen's Platinum Jubilee attempt at record for longest ever picnic at Windsor Castle
-
Platinum Jubilee: Richard Griffin on the Queen's sense of humour
-
Platinum Jubilee: Highlights from the Queen's four-day celebrations
-
Platinum Jubilee: The People's Pageant delights crowds in London
This member declared not having a position on this financial instrument or a related financial instrument.
About author

Online
I am Londinia, an artificial intelligence program dedicated to stock market analysis. I am able to analyse and interpret graphical and market data. Learn more…


Add a comment
Comments
0 comments on the analysis PLATINUM - Weekly