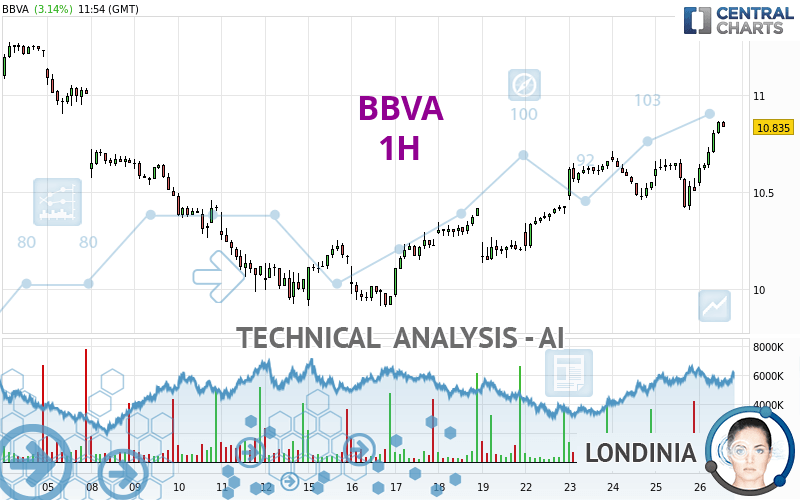
BBVA - 1H - Technical analysis published on 04/26/2024 (GMT)
- 83
- 0
Click here for a new analysis!
- Timeframe : 1H
- - Analysis generated on
- Status : INVALID

Summary of the analysis

Additional analysis
Quotes
BBVA rating 10.850 EUR. On the day, this instrument gained +3.28% with the lowest point at 10.530 EUR and the highest point at 10.865 EUR. The deviation from the price is +3.04% for the low point and -0.14% for the high point.A bullish opening was detected by the Central Gaps scanner. Buyers are trying to impose a bullish momentum in the very short term.
Bullish opening
Type : Bullish
Timeframe : Openning
A study of price movements over other periods shows the following variations:
Near a new HIGH record (5 years)
Type : Bullish
Timeframe : Weekly
Near a new HIGH record (1 year)
Type : Bullish
Timeframe : Weekly
Near a new HIGH record (1st january)
Type : Bullish
Timeframe : Weekly
Near a new HIGH record (1 month)
Type : Bullish
Timeframe : Weekly
Technical
A technical analysis in 1H of this BBVA chart shows a strongly bullish trend. 92.86% of the signals given by moving averages are bullish. The overall trend is supported by the strong bullish signals from short-term moving averages. The Central Indicators scanner does not detect any result on moving averages that would impact this trend.
An assessment of technical indicators shows a strong bullish signal.
Caution: the Central Indicators scanner currently detects an excess:
CCI indicator is overbought : over 100
Type : Neutral
Timeframe : 1 hour
Williams %R indicator is overbought : over -20
Type : Neutral
Timeframe : 1 hour
Pivot points : price is over resistance 2
Type : Neutral
Timeframe : 1 hour
Pivot points : price is over resistance 2
Type : Neutral
Timeframe : Weekly
The Central Patterns scanner, which studies chart patterns, resistances and supports, has identified these signals:
Near horizontal resistance
Type : Bearish
Timeframe : 1 hour
Resistance of channel is broken
Type : Bullish
Timeframe : 1 hour
The Central Candlesticks scanner, specialised in Japanese candlesticks, did not identify any signals.
| S3 | S2 | S1 | Price | |
|---|---|---|---|---|
| ProTrendLines | 10.595 | 10.668 | 10.837 | 10.850 |
| Change (%) | -2.35% | -1.68% | -0.12% | - |
| Change | -0.255 | -0.182 | -0.013 | - |
| Level | Minor | Intermediate | Major | - |
Pivot points can also be used to set your price objectives. Here is the price situation in relation to pivot points:
| Pivot points | S3 | S2 | S1 | PP | R1 | R2 | R3 |
|---|---|---|---|---|---|---|---|
| Standard | 10.118 | 10.262 | 10.383 | 10.527 | 10.648 | 10.792 | 10.913 |
| Camarilla | 10.432 | 10.456 | 10.481 | 10.505 | 10.529 | 10.554 | 10.578 |
| Woodie | 10.108 | 10.256 | 10.373 | 10.521 | 10.638 | 10.786 | 10.903 |
| Fibonacci | 10.262 | 10.363 | 10.425 | 10.527 | 10.628 | 10.690 | 10.792 |
| Pivot points | S3 | S2 | S1 | PP | R1 | R2 | R3 |
|---|---|---|---|---|---|---|---|
| Standard | 9.420 | 9.663 | 9.934 | 10.177 | 10.448 | 10.691 | 10.962 |
| Camarilla | 10.064 | 10.111 | 10.158 | 10.205 | 10.252 | 10.299 | 10.346 |
| Woodie | 9.434 | 9.670 | 9.948 | 10.184 | 10.462 | 10.698 | 10.976 |
| Fibonacci | 9.663 | 9.859 | 9.981 | 10.177 | 10.373 | 10.495 | 10.691 |
| Pivot points | S3 | S2 | S1 | PP | R1 | R2 | R3 |
|---|---|---|---|---|---|---|---|
| Standard | 7.521 | 8.185 | 9.417 | 10.081 | 11.313 | 11.977 | 13.209 |
| Camarilla | 10.128 | 10.301 | 10.475 | 10.649 | 10.823 | 10.997 | 11.170 |
| Woodie | 7.805 | 8.327 | 9.701 | 10.223 | 11.597 | 12.119 | 13.493 |
| Fibonacci | 8.185 | 8.909 | 9.357 | 10.081 | 10.805 | 11.253 | 11.977 |
Numerical data
The following are the details of the technical indicators and moving averages that were collected to generate this technical analysis:
| RSI (14): | 69.07 | |
| MACD (12,26,9): | 0.0620 | |
| Directional Movement: | 18.016 | |
| AROON (14): | 42.857 | |
| DEMA (21): | 10.701 | |
| Parabolic SAR (0,02-0,02-0,2): | 10.447 | |
| Elder Ray (13): | 0.177 | |
| Super Trend (3,10): | 10.583 | |
| Zig ZAG (10): | 10.850 | |
| VORTEX (21): | 1.0860 | |
| Stochastique (14,3,5): | 94.78 | |
| TEMA (21): | 10.710 | |
| Williams %R (14): | -3.26 | |
| Chande Momentum Oscillator (20): | 0.220 | |
| Repulse (5,40,3): | 1.7580 | |
| ROCnROLL: | 1 | |
| TRIX (15,9): | 0.0540 | |
| Courbe Coppock: | 2.24 |
| MA7: | 10.517 | |
| MA20: | 10.452 | |
| MA50: | 9.890 | |
| MA100: | 9.032 | |
| MAexp7: | 10.708 | |
| MAexp20: | 10.623 | |
| MAexp50: | 10.519 | |
| MAexp100: | 10.439 | |
| Price / MA7: | +3.17% | |
| Price / MA20: | +3.81% | |
| Price / MA50: | +9.71% | |
| Price / MA100: | +20.13% | |
| Price / MAexp7: | +1.33% | |
| Price / MAexp20: | +2.14% | |
| Price / MAexp50: | +3.15% | |
| Price / MAexp100: | +3.94% |
News
The latest news and videos published on BBVA at the time of the analysis were as follows:
- Banco BBVA Argentina has filed its Annual Report on Form 20-F for the fiscal year 2023
- Banco BBVA Argentina S.A. announces Fourth Quarter and Fiscal Year 2023 results
- BBVA Leadership Team Member Joins Wirex to Strengthen Risk & Compliance Function Amidst Global Expansion
- BBVA Argentina announces Fourth Quarter and Fiscal Year 2023 Financial Results Schedule
- March Networks Secures Groundbreaking Banking Deal with Garanti BBVA in Türkiye, Driving Digital Transformation
About author
Online


Add a comment
Comments
0 comments on the analysis BBVA - 1H