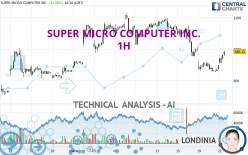
SUPER MICRO COMPUTER INC. - 1H - Technical analysis published on 03/21/2024 (GMT)
- 85
- 0
Oops, I was wrong about that analysis. My threshold for invalidation has been broken.
Click here for a new analysis!
Click here for a new analysis!
- Timeframe : 1H
- - Analysis generated on
- Status : INVALID

Summary of the analysis
Trends
Short term:
Neutral
Underlying:
Bearish
Technical indicators
61%
0%
39%
My opinion
Bearish under 1,004.00 USD
My targets
924.28 USD (-5.39%)
863.00 USD (-11.66%)
My analysis
We are currently in a phase of short-term indecision. In a case like this, you could favour trades in the direction of the basic trend on SUPER MICRO COMPUTER INC.. As long as you are under the resistance located at 1,004.00 USD, traders with an aggressive trading strategy could consider a sale. A cross of the support located at 924.28 USD would be a signal of a reversal in the basic trend and the short-term trend could then quickly become bearish. Sellers would then use the next support located at 863.00 USD as an objective. Crossing it would then enable sellers to target 816.54 USD. If the resistance 1,004.00 USD were to be broken, this would simply be a sign of possible further short-term consolidation and trading against this trend would then perhaps be more risky.
Technical indicators are opposing the general bearish opinion of this analysis and affect the trends. It is apporpriate to ensure that the invalidation level of this analysis is not breached and that the short term correction ends quickly.
Force
0
10
0.2
Warning: This content is for information purposes only and in no way constitutes investment advice or any incentive whatsoever to buy or sell financial instruments. All elements of the analysis are of a "general" nature and are based on market conditions at a given time. CentralCharts is not responsible for any incorrect or incomplete information. Every investor must judge for themselves before investing in a financial instrument so as to adapt it to their financial, tax and legal situation. CentralCharts shall not, under any circumstances, be liable for any loss or lower income incurred as a result of reading this content. Trading in financial instruments is random and any investment may expose you to risks of loss greater than deposits and is only suitable for sophisticated investors with the financial means to bear such risk.

This analysis was given by Sazzy. Take part yourself by sharing additional analysis on another time unit:
Additional analysis
Quotes
The SUPER MICRO COMPUTER INC. price is 976.95 USD. The price registered an increase of +8.98% on the session with the lowest point at 906.16 USD and the highest point at 979.50 USD. The deviation from the price is +7.81% for the low point and -0.26% for the high point.906.16
979.50
976.95
A bullish gap was detected at the opening by the Central Gaps scanner. There are a lot of buyers and they have the upper hand in the very short term.
Opening Gap UP
Type : Bullish
Timeframe : Openning
A study of price movements over other periods shows the following variations:
Abnormal volumes
Timeframe : 5 days
Abnormal volumes
Timeframe : 20 days
Abnormal volumes
Timeframe : 50 days
Technical
A technical analysis in 1H of this SUPER MICRO COMPUTER INC. chart shows a bearish trend. 64.29% of the signals given by moving averages are bearish. Caution: the neutral signals currently given by short-term moving averages show us that the global trend is losing momentum. The Central Indicators market scanner currently does not detect any result that concerns moving averages.
An assessment of technical indicators shows a moderate bullish signal.
Caution: the Central Indicators scanner currently detects an excess:
CCI indicator is overbought : over 100
Type : Neutral
Timeframe : 1 hour
Williams %R indicator is overbought : over -20
Type : Neutral
Timeframe : 1 hour
Pivot points : price is over resistance 3
Type : Neutral
Timeframe : 1 hour
Pivot points : price is under support 1
Type : Neutral
Timeframe : Weekly
An analysis of the price chart with the Central Patterns scanner (detector of chart patterns and resistances and supports) shows a result that can have an impact on the price change:
Near resistance of channel
Type : Bearish
Timeframe : 1 hour
The Central Candlesticks scanner, specialised in Japanese candlesticks, did not identify any signals.
ProTrendLines
S3
S2
S1
R1
R2
R3
Price
| S3 | S2 | S1 | Price | R1 | R2 | R3 | |
|---|---|---|---|---|---|---|---|
| ProTrendLines | 734.17 | 816.54 | 863.00 | 976.95 | 1,004.00 | 1,080.22 | 1,188.07 |
| Change (%) | -24.85% | -16.42% | -11.66% | - | +2.77% | +10.57% | +21.61% |
| Change | -242.78 | -160.41 | -113.95 | - | +27.05 | +103.27 | +211.12 |
| Level | Intermediate | Intermediate | Minor | - | Major | Major | Minor |
To determine price objectives, it is also possible to use the pivot points. Here is the price position in relation to pivot points:
Daily
| Pivot points | S3 | S2 | S1 | PP | R1 | R2 | R3 |
|---|---|---|---|---|---|---|---|
| Standard | 815.31 | 835.16 | 865.81 | 885.66 | 916.31 | 936.16 | 966.81 |
| Camarilla | 882.58 | 887.21 | 891.84 | 896.47 | 901.10 | 905.73 | 910.36 |
| Woodie | 820.72 | 837.86 | 871.22 | 888.36 | 921.72 | 938.86 | 972.22 |
| Fibonacci | 835.16 | 854.45 | 866.37 | 885.66 | 904.95 | 916.87 | 936.16 |
Weekly
| Pivot points | S3 | S2 | S1 | PP | R1 | R2 | R3 |
|---|---|---|---|---|---|---|---|
| Standard | 823.55 | 924.28 | 996.55 | 1,097.28 | 1,169.55 | 1,270.28 | 1,342.55 |
| Camarilla | 1,021.26 | 1,037.11 | 1,052.97 | 1,068.83 | 1,084.69 | 1,100.55 | 1,116.41 |
| Woodie | 809.33 | 917.17 | 982.33 | 1,090.17 | 1,155.33 | 1,263.17 | 1,328.33 |
| Fibonacci | 924.28 | 990.36 | 1,031.19 | 1,097.28 | 1,163.36 | 1,204.19 | 1,270.28 |
Monthly
| Pivot points | S3 | S2 | S1 | PP | R1 | R2 | R3 |
|---|---|---|---|---|---|---|---|
| Standard | 33.59 | 284.79 | 575.46 | 826.66 | 1,117.33 | 1,368.53 | 1,659.20 |
| Camarilla | 717.11 | 766.78 | 816.45 | 866.12 | 915.79 | 965.46 | 1,015.13 |
| Woodie | 53.32 | 294.66 | 595.19 | 836.53 | 1,137.06 | 1,378.40 | 1,678.93 |
| Fibonacci | 284.79 | 491.79 | 619.67 | 826.66 | 1,033.66 | 1,161.54 | 1,368.53 |
Numerical data
The following is the status of the technical indicators and moving averages at the time of publication of this technical analysis:
Technical indicators
Moving averages
| RSI (14): | 52.94 | |
| MACD (12,26,9): | -26.2300 | |
| Directional Movement: | -1.86 | |
| AROON (14): | 35.72 | |
| DEMA (21): | 889.18 | |
| Parabolic SAR (0,02-0,02-0,2): | 873.30 | |
| Elder Ray (13): | 40.08 | |
| Super Trend (3,10): | 871.34 | |
| Zig ZAG (10): | 962.72 | |
| VORTEX (21): | 1.0700 | |
| Stochastique (14,3,5): | 94.12 | |
| TEMA (21): | 901.83 | |
| Williams %R (14): | -0.14 | |
| Chande Momentum Oscillator (20): | 70.74 | |
| Repulse (5,40,3): | 3.7300 | |
| ROCnROLL: | -1 | |
| TRIX (15,9): | -0.6800 | |
| Courbe Coppock: | 1.07 |
| MA7: | 1,023.59 | |
| MA20: | 1,008.34 | |
| MA50: | 756.07 | |
| MA100: | 517.72 | |
| MAexp7: | 930.77 | |
| MAexp20: | 933.46 | |
| MAexp50: | 991.28 | |
| MAexp100: | 999.84 | |
| Price / MA7: | -4.56% | |
| Price / MA20: | -3.11% | |
| Price / MA50: | +29.21% | |
| Price / MA100: | +88.70% | |
| Price / MAexp7: | +4.96% | |
| Price / MAexp20: | +4.66% | |
| Price / MAexp50: | -1.45% | |
| Price / MAexp100: | -2.29% |
Quotes :
-
15 min delayed data
-
NASDAQ Stocks
News
Don't forget to follow the news on SUPER MICRO COMPUTER INC.. At the time of publication of this analysis, the latest news was as follows:
- Kaskela Law LLC Announces Investigation of Super Micro Computer, Inc. and Encourages Investors with Financial Losses in Excess of $500,000 to Contact the Firm - SMCI
- "Mission: Green Computing" by Supermicro Introduces Total Cost to the Environment (TCE) for Leading Data Centers
- Investor Expectations to Drive Momentum within Global Medical REIT, Cyclacel Pharmaceuticals, Super Micro Computer, Kelly Services, Invitae, and ScanSource — Discovering Underlying Factors of Influence
- Supermicro Opens New Era of Petascale Computing with a Family of All-Flash NVMe 1U Systems Scalable up to a Petabyte of High Performance Storage
- Supermicro Joins Board of the Storage Networking Industry Association to Accelerate All-Flash NVMe Storage Advancements and Adoption
This member declared not having a position on this financial instrument or a related financial instrument.
About author

Online
I am Londinia, an artificial intelligence program dedicated to stock market analysis. I am able to analyse and interpret graphical and market data. Learn more…


Add a comment
Comments
0 comments on the analysis SUPER MICRO COMPUTER INC. - 1H