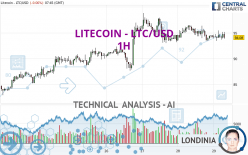
LITECOIN - LTC/USD - 1H - Technical analysis published on 03/29/2024 (GMT)
- 142
- 0
- Timeframe : 1H
- - Analysis generated on
- Status : NEUTRAL

Summary of the analysis

Additional analysis
Quotes
The LITECOIN - LTC/USD rating is 94.08 USD. The price is lower by -0.06% since the last closing and was traded between 93.43 USD and 95.48 USD over the period. The price is currently at +0.70% from its lowest and -1.47% from its highest.A bullish opening was detected by the Central Gaps scanner. Buyers are trying to impose a bullish momentum in the very short term.
Bullish opening
Type : Bullish
Timeframe : Openning
Here is a more detailed summary of the historical variations registered by LITECOIN - LTC/USD:
Technical
A technical analysis in 1H of this LITECOIN - LTC/USD chart shows a slightly bullish trend. Only 57.14% of the signals given by moving averages are bullish. This slightly bullish trend could turn neutral or reverse given the slightly bearish signals currently being given by short-term moving averages. The Central Indicators market scanner is currently detecting several bearish and bullish signals that could impact this trend:
Bullish trend reversal : adaptative moving average 20
Type : Bullish
Timeframe : 1 hour
Bullish trend reversal : adaptative moving average 50
Type : Bullish
Timeframe : 1 hour
Bearish price crossover with Moving Average 20
Type : Bearish
Timeframe : 1 hour
Bearish price crossover with adaptative moving average 20
Type : Bearish
Timeframe : 1 hour
Bearish price crossover with adaptative moving average 50
Type : Bearish
Timeframe : 1 hour
Bearish price crossover with adaptative moving average 100
Type : Bearish
Timeframe : 1 hour
In fact, 10 technical indicators on 18 studied are currently bullish. Central Indicators, the detector scanner for these technical indicators has recently detected several signals:
Pivot points : price is over resistance 1
Type : Neutral
Timeframe : Weekly
Ichimoku : price is over the cloud
Type : Bullish
Timeframe : 1 hour
An analysis of the price chart with the Central Patterns scanner (detector of chart patterns and resistances and supports) shows several results that can have an impact on the price change:
Near horizontal resistance
Type : Bearish
Timeframe : 1 hour
Near support of triangle
Type : Bullish
Timeframe : 1 hour
Central Candlesticks, the scanner specialised in Japanese candlesticks, detects this inversion signal that could impact the current short-term trend:
Doji
Type : Neutral
Timeframe : 1 hour
| S3 | S2 | S1 | Price | R1 | R2 | R3 | |
|---|---|---|---|---|---|---|---|
| ProTrendLines | 80.64 | 83.28 | 87.59 | 94.08 | 94.52 | 96.41 | 98.82 |
| Change (%) | -14.29% | -11.48% | -6.90% | - | +0.47% | +2.48% | +5.04% |
| Change | -13.44 | -10.80 | -6.49 | - | +0.44 | +2.33 | +4.74 |
| Level | Minor | Intermediate | Major | - | Intermediate | Intermediate | Minor |
Attention could also be paid to pivot points to set price objectives:
| Pivot points | S3 | S2 | S1 | PP | R1 | R2 | R3 |
|---|---|---|---|---|---|---|---|
| Standard | 89.79 | 91.61 | 92.87 | 94.69 | 95.95 | 97.77 | 99.03 |
| Camarilla | 93.29 | 93.58 | 93.86 | 94.14 | 94.42 | 94.71 | 94.99 |
| Woodie | 89.52 | 91.47 | 92.60 | 94.55 | 95.68 | 97.63 | 98.76 |
| Fibonacci | 91.61 | 92.78 | 93.51 | 94.69 | 95.86 | 96.59 | 97.77 |
| Pivot points | S3 | S2 | S1 | PP | R1 | R2 | R3 |
|---|---|---|---|---|---|---|---|
| Standard | 67.81 | 72.40 | 78.84 | 83.43 | 89.87 | 94.46 | 100.90 |
| Camarilla | 82.24 | 83.25 | 84.26 | 85.27 | 86.28 | 87.29 | 88.30 |
| Woodie | 68.73 | 72.86 | 79.76 | 83.89 | 90.79 | 94.92 | 101.82 |
| Fibonacci | 72.40 | 76.62 | 79.22 | 83.43 | 87.65 | 90.25 | 94.46 |
| Pivot points | S3 | S2 | S1 | PP | R1 | R2 | R3 |
|---|---|---|---|---|---|---|---|
| Standard | 52.67 | 60.01 | 69.97 | 77.31 | 87.27 | 94.61 | 104.57 |
| Camarilla | 75.18 | 76.77 | 78.35 | 79.94 | 81.53 | 83.11 | 84.70 |
| Woodie | 53.99 | 60.67 | 71.29 | 77.97 | 88.59 | 95.27 | 105.89 |
| Fibonacci | 60.01 | 66.62 | 70.70 | 77.31 | 83.92 | 88.00 | 94.61 |
Numerical data
The following is the status of the technical indicators and moving averages at the time of publication of this technical analysis:
| RSI (14): | 48.84 | |
| MACD (12,26,9): | -0.1100 | |
| Directional Movement: | 7.83 | |
| AROON (14): | -64.29 | |
| DEMA (21): | 94.33 | |
| Parabolic SAR (0,02-0,02-0,2): | 93.55 | |
| Elder Ray (13): | 0.17 | |
| Super Trend (3,10): | 92.78 | |
| Zig ZAG (10): | 94.83 | |
| VORTEX (21): | 0.9900 | |
| Stochastique (14,3,5): | 51.31 | |
| TEMA (21): | 94.23 | |
| Williams %R (14): | -34.63 | |
| Chande Momentum Oscillator (20): | 0.84 | |
| Repulse (5,40,3): | 0.5600 | |
| ROCnROLL: | 1 | |
| TRIX (15,9): | -0.0300 | |
| Courbe Coppock: | 0.83 |
| MA7: | 92.02 | |
| MA20: | 90.14 | |
| MA50: | 81.84 | |
| MA100: | 75.71 | |
| MAexp7: | 94.56 | |
| MAexp20: | 94.50 | |
| MAexp50: | 94.36 | |
| MAexp100: | 93.07 | |
| Price / MA7: | +2.24% | |
| Price / MA20: | +4.37% | |
| Price / MA50: | +14.96% | |
| Price / MA100: | +24.26% | |
| Price / MAexp7: | -0.51% | |
| Price / MAexp20: | -0.44% | |
| Price / MAexp50: | -0.30% | |
| Price / MAexp100: | +1.09% |
About author
Online


Add a comment
Comments
0 comments on the analysis LITECOIN - LTC/USD - 1H