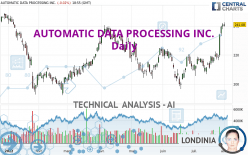
AUTOMATIC DATA PROCESSING INC. - Daily - Technical analysis published on 08/01/2022 (GMT)
- 213
- 0
Click here for a new analysis!
- Timeframe : Daily
- - Analysis generated on
- Status : TARGET REACHED

Summary of the analysis

Additional analysis
Quotes
The AUTOMATIC DATA PROCESSING INC. price is 241.07 USD. On the day, this instrument lost -0.02% with the lowest point at 239.56 USD and the highest point at 242.51 USD. The deviation from the price is +0.63% for the low point and -0.59% for the high point.A bearish opening was detected by the Central Gaps scanner. Sellers are trying to impose a bearish trend in the very short term.
Bearish opening
Type : Bearish
Timeframe : Openning
A study of price movements over other periods shows the following variations:
Near a new HIGH record (5 years)
Type : Bullish
Timeframe : Weekly
Near a new HIGH record (1 year)
Type : Bullish
Timeframe : Weekly
Near a new HIGH record (1st january)
Type : Bullish
Timeframe : Weekly
New HIGH record (1 month)
Type : Bullish
Timeframe : Weekly
Technical
Technical analysis of AUTOMATIC DATA PROCESSING INC. in Daily shows a strongly overall bullish trend. 89.29% of the signals given by moving averages are bullish. This strongly bullish trend is supported by the strong bullish signals given by short-term moving averages. The Central Indicators market scanner currently does not detect any result that concerns moving averages.
An assessment of technical indicators shows a strong bullish signal.
Caution: the Central Indicators scanner currently detects an excess:
RSI indicator is overbought : over 70
Type : Neutral
Timeframe : Daily
CCI indicator is overbought : over 100
Type : Neutral
Timeframe : Daily
Previous candle closed over Bollinger bands
Type : Neutral
Timeframe : Daily
Williams %R indicator is overbought : over -20
Type : Neutral
Timeframe : Daily
Price is back over the pivot point
Type : Bullish
Timeframe : Daily
An analysis of the price chart with the Central Patterns scanner (detector of chart patterns and resistances and supports) shows several results that can have an impact on the price change:
Near horizontal resistance
Type : Bearish
Timeframe : Daily
Resistance of channel is broken
Type : Bullish
Timeframe : Daily
No result was found by the Central Candlesticks scanner on Japanese candlesticks.
| S3 | S2 | S1 | Price | R1 | |
|---|---|---|---|---|---|
| ProTrendLines | 217.26 | 223.65 | 237.36 | 241.07 | 245.59 |
| Change (%) | -9.88% | -7.23% | -1.54% | - | +1.87% |
| Change | -23.81 | -17.42 | -3.71 | - | +4.52 |
| Level | Major | Minor | Intermediate | - | Major |
Pivot points can also be used to set your price objectives. Here is the price situation in relation to pivot points:
| Pivot points | S3 | S2 | S1 | PP | R1 | R2 | R3 |
|---|---|---|---|---|---|---|---|
| Standard | 234.38 | 236.09 | 238.61 | 240.32 | 242.84 | 244.55 | 247.07 |
| Camarilla | 239.96 | 240.35 | 240.73 | 241.12 | 241.51 | 241.90 | 242.28 |
| Woodie | 234.78 | 236.29 | 239.01 | 240.52 | 243.24 | 244.75 | 247.47 |
| Fibonacci | 236.09 | 237.71 | 238.71 | 240.32 | 241.94 | 242.94 | 244.55 |
| Pivot points | S3 | S2 | S1 | PP | R1 | R2 | R3 |
|---|---|---|---|---|---|---|---|
| Standard | 198.63 | 207.49 | 224.31 | 233.17 | 249.99 | 258.85 | 275.67 |
| Camarilla | 234.06 | 236.41 | 238.77 | 241.12 | 243.47 | 245.83 | 248.18 |
| Woodie | 202.60 | 209.48 | 228.28 | 235.16 | 253.96 | 260.84 | 279.64 |
| Fibonacci | 207.49 | 217.30 | 223.36 | 233.17 | 242.98 | 249.04 | 258.85 |
| Pivot points | S3 | S2 | S1 | PP | R1 | R2 | R3 |
|---|---|---|---|---|---|---|---|
| Standard | 180.71 | 193.16 | 217.14 | 229.59 | 253.57 | 266.02 | 290.00 |
| Camarilla | 231.10 | 234.44 | 237.78 | 241.12 | 244.46 | 247.80 | 251.14 |
| Woodie | 186.48 | 196.04 | 222.91 | 232.47 | 259.34 | 268.90 | 295.77 |
| Fibonacci | 193.16 | 207.08 | 215.67 | 229.59 | 243.51 | 252.10 | 266.02 |
Numerical data
The following is the status of technical indicators and moving averages registered at the time this technical analysis was created:
| RSI (14): | 72.39 | |
| MACD (12,26,9): | 6.1400 | |
| Directional Movement: | 24.88 | |
| AROON (14): | 85.71 | |
| DEMA (21): | 229.85 | |
| Parabolic SAR (0,02-0,02-0,2): | 218.95 | |
| Elder Ray (13): | 14.25 | |
| Super Trend (3,10): | 224.19 | |
| Zig ZAG (10): | 240.64 | |
| VORTEX (21): | 1.2100 | |
| Stochastique (14,3,5): | 96.64 | |
| TEMA (21): | 235.24 | |
| Williams %R (14): | -5.11 | |
| Chande Momentum Oscillator (20): | 29.49 | |
| Repulse (5,40,3): | 4.2800 | |
| ROCnROLL: | 1 | |
| TRIX (15,9): | 0.2000 | |
| Courbe Coppock: | 16.07 |
| MA7: | 230.29 | |
| MA20: | 220.17 | |
| MA50: | 215.81 | |
| MA100: | 217.99 | |
| MAexp7: | 232.54 | |
| MAexp20: | 223.19 | |
| MAexp50: | 218.42 | |
| MAexp100: | 217.04 | |
| Price / MA7: | +4.68% | |
| Price / MA20: | +9.49% | |
| Price / MA50: | +11.70% | |
| Price / MA100: | +10.59% | |
| Price / MAexp7: | +3.67% | |
| Price / MAexp20: | +8.01% | |
| Price / MAexp50: | +10.37% | |
| Price / MAexp100: | +11.07% |
News
The last news published on AUTOMATIC DATA PROCESSING INC. at the time of the generation of this analysis was as follows:
- Thinking about trading options or stock in Automatic Data Processing, Wingstop, Apple, Solaredge Technologies, or Enphase Energy?
- Thinking about trading options or stock in Cheniere Energy, Automatic Data Processing, Tesla, Southern Co, or Johnson & Johnson?
- Thinking about trading options or stock in Pfizer, Marathon Digital, Automatic Data Processing, Broadcom, or Apple?
- It's Official: Post-Pandemic Work Schedules Will Be Flexible
- It’s Heads Down for the Holidays: Half of Working Canadians Taking Less or No Vacation Time this Holiday Season
About author
Online


Add a comment
Comments
0 comments on the analysis AUTOMATIC DATA PROCESSING INC. - Daily