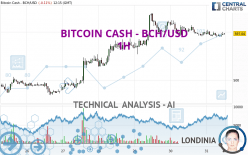
BITCOIN CASH - BCH/USD - 1H - Technical analysis published on 03/31/2024 (GMT)
- 185
- 0
Click here for a new analysis!
- Timeframe : 1H
- - Analysis generated on
- Status : TARGET REACHED

Summary of the analysis

Additional analysis
Quotes
The BITCOIN CASH - BCH/USD price is 597.04 USD. On the day, this instrument lost -0.11% with the lowest point at 589.26 USD and the highest point at 604.86 USD. The deviation from the price is +1.32% for the low point and -1.29% for the high point.The Central Gaps scanner detects a bullish opening. A small advantage for buyers in the very short term.
Bullish opening
Type : Bullish
Timeframe : Openning
A study of price movements over other periods shows the following variations:
New HIGH record (1 year)
Type : Bullish
Timeframe : Weekly
New HIGH record (1st january)
Type : Bullish
Timeframe : Weekly
New HIGH record (1 month)
Type : Bullish
Timeframe : Weekly
Abnormal volumes on BITCOIN CASH - BCH/USD were detected by the Central Volumes scanner:
Abnormal volumes
Timeframe : 5 days
Abnormal volumes
Timeframe : 20 days
Abnormal volumes
Timeframe : 50 days
Technical
Technical analysis of this 1H chart of BITCOIN CASH - BCH/USD indicates that the overall trend is bullish. The signals given by moving averages are 67.86% bullish. This bullish trend could slow down given the neutral signals currently being given by short-term moving averages. An assessment of moving averages reveals a bearish signal that could impact this trend:
Bearish trend reversal : Moving Average 50
Type : Bearish
Timeframe : 1 hour
The probability of a further increase are moderate given the direction of the technical indicators.
Caution: the Central Indicators scanner currently detects an excess:
MACD indicator: bearish divergence
Type : Bearish
Timeframe : 1 hour
Pivot points : price is over resistance 1
Type : Neutral
Timeframe : 1 hour
Pivot points : price is over resistance 2
Type : Neutral
Timeframe : Weekly
MACD crosses UP its Moving Average
Type : Bullish
Timeframe : 1 hour
Ichimoku : price is under the cloud
Type : Bearish
Timeframe : 1 hour
Momentum indicator is back over 0
Type : Bullish
Timeframe : 1 hour
Williams %R indicator is back under -50
Type : Bearish
Timeframe : 1 hour
Central Patterns, the scanner specializing in chart patterns, did not identify any signals.
No result was found by the Central Candlesticks scanner on Japanese candlesticks.
| S3 | S2 | S1 | Price | R1 | R2 | R3 | |
|---|---|---|---|---|---|---|---|
| ProTrendLines | 474.33 | 501.24 | 548.97 | 597.04 | 598.42 | 639.58 | 717.39 |
| Change (%) | -20.55% | -16.05% | -8.05% | - | +0.23% | +7.13% | +20.16% |
| Change | -122.71 | -95.80 | -48.07 | - | +1.38 | +42.54 | +120.35 |
| Level | Minor | Major | Intermediate | - | Intermediate | Intermediate | Minor |
Pivot points can also be used to set your price objectives. Here is the price situation in relation to pivot points:
| Pivot points | S3 | S2 | S1 | PP | R1 | R2 | R3 |
|---|---|---|---|---|---|---|---|
| Standard | 551.48 | 571.40 | 584.54 | 604.46 | 617.60 | 637.52 | 650.66 |
| Camarilla | 588.58 | 591.61 | 594.64 | 597.67 | 600.70 | 603.73 | 606.76 |
| Woodie | 548.08 | 569.71 | 581.14 | 602.77 | 614.20 | 635.83 | 647.26 |
| Fibonacci | 571.40 | 584.03 | 591.83 | 604.46 | 617.09 | 624.89 | 637.52 |
| Pivot points | S3 | S2 | S1 | PP | R1 | R2 | R3 |
|---|---|---|---|---|---|---|---|
| Standard | 287.92 | 366.64 | 482.15 | 560.87 | 676.38 | 755.10 | 870.61 |
| Camarilla | 544.26 | 562.06 | 579.87 | 597.67 | 615.47 | 633.28 | 651.08 |
| Woodie | 306.33 | 375.84 | 500.56 | 570.07 | 694.79 | 764.30 | 889.02 |
| Fibonacci | 366.64 | 440.83 | 486.67 | 560.87 | 635.06 | 680.90 | 755.10 |
| Pivot points | S3 | S2 | S1 | PP | R1 | R2 | R3 |
|---|---|---|---|---|---|---|---|
| Standard | 179.16 | 212.98 | 255.55 | 289.37 | 331.94 | 365.76 | 408.33 |
| Camarilla | 277.11 | 284.12 | 291.12 | 298.12 | 305.12 | 312.13 | 319.13 |
| Woodie | 183.54 | 215.17 | 259.93 | 291.56 | 336.32 | 367.95 | 412.71 |
| Fibonacci | 212.98 | 242.16 | 260.19 | 289.37 | 318.55 | 336.58 | 365.76 |
Numerical data
The following are the details of the technical indicators and moving averages that were collected to generate this technical analysis:
| RSI (14): | 48.83 | |
| MACD (12,26,9): | -1.7700 | |
| Directional Movement: | 11.23 | |
| AROON (14): | -42.86 | |
| DEMA (21): | 593.91 | |
| Parabolic SAR (0,02-0,02-0,2): | 589.48 | |
| Elder Ray (13): | 0.99 | |
| Super Trend (3,10): | 588.62 | |
| Zig ZAG (10): | 596.47 | |
| VORTEX (21): | 0.9900 | |
| Stochastique (14,3,5): | 38.03 | |
| TEMA (21): | 592.11 | |
| Williams %R (14): | -47.37 | |
| Chande Momentum Oscillator (20): | 1.31 | |
| Repulse (5,40,3): | 0.1700 | |
| ROCnROLL: | 1 | |
| TRIX (15,9): | -0.0600 | |
| Courbe Coppock: | 1.01 |
| MA7: | 555.50 | |
| MA20: | 468.44 | |
| MA50: | 386.85 | |
| MA100: | 315.40 | |
| MAexp7: | 594.65 | |
| MAexp20: | 596.05 | |
| MAexp50: | 593.90 | |
| MAexp100: | 574.85 | |
| Price / MA7: | +7.48% | |
| Price / MA20: | +27.45% | |
| Price / MA50: | +54.33% | |
| Price / MA100: | +89.30% | |
| Price / MAexp7: | +0.40% | |
| Price / MAexp20: | +0.17% | |
| Price / MAexp50: | +0.53% | |
| Price / MAexp100: | +3.86% |
About author
Online


Add a comment
Comments
0 comments on the analysis BITCOIN CASH - BCH/USD - 1H