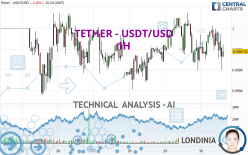
TETHER - USDT/USD - 1H - Technical analysis published on 04/30/2024 (GMT)
- 96
- 0
Click here for a new analysis!
- Timeframe : 1H
- - Analysis generated on
- Status : TARGET REACHED

Summary of the analysis

Additional analysis
Quotes
The TETHER - USDT/USD rating is 0.999778 USD. On the day, this instrument gained +0.00% and was traded between 0.999599 USD and 1.000030 USD over the period. The price is currently at +0.02% from its lowest and -0.03% from its highest.Here is a more detailed summary of the historical variations registered by TETHER - USDT/USD:
Near a new LOW record (5 years)
Type : Bearish
Timeframe : Weekly
Near a new HIGH record (1 year)
Type : Bullish
Timeframe : Weekly
Near a new HIGH record (1st january)
Type : Bullish
Timeframe : Weekly
Near a new HIGH record (1 month)
Type : Bullish
Timeframe : Weekly
Technical
Technical analysis of this 1H chart of TETHER - USDT/USD indicates that the overall trend is bearish. 67.86% of the signals given by moving averages are bearish. This bearish trend is supported by the strong bearish signals given by short-term moving averages. The Central Indicators scanner detects bullish signals on moving averages that could impact this trend:
Bullish price crossover with adaptative moving average 50
Type : Bullish
Timeframe : 1 hour
Bullish price crossover with adaptative moving average 100
Type : Bullish
Timeframe : 1 hour
On the 18 technical indicators analysed, 5 are bullish, 6 are neutral and 7 are bearish. But beware of excesses. The Central Indicators scanner currently detects this:
CCI indicator is oversold : under -100
Type : Neutral
Timeframe : 1 hour
CCI indicator: bullish divergence
Type : Bullish
Timeframe : 1 hour
Williams %R indicator is oversold : under -80
Type : Neutral
Timeframe : 1 hour
RSI indicator is back under 50
Type : Bearish
Timeframe : 1 hour
Ichimoku : price is under the cloud
Type : Bearish
Timeframe : 1 hour
MACD indicator is back under 0
Type : Bearish
Timeframe : 1 hour
Momentum indicator is back under 0
Type : Bearish
Timeframe : 1 hour
Central Patterns, the market scanner focusing on chart patterns, resistances and supports found these results:
Near resistance of channel
Type : Bearish
Timeframe : 1 hour
Near resistance of triangle
Type : Bearish
Timeframe : 1 hour
The Central Candlesticks scanner which studies Japanese candlesticks did not detect anything.
| S3 | S2 | S1 | Price | R1 | R2 | R3 | |
|---|---|---|---|---|---|---|---|
| ProTrendLines | 0.999109 | 0.999324 | 0.999562 | 0.999778 | 1.000038 | 1.000284 | 1.000647 |
| Change (%) | -0.07% | -0.05% | -0.02% | - | +0.03% | +0.05% | +0.09% |
| Change | -0.000669 | -0.000454 | -0.000216 | - | +0.000260 | +0.000506 | +0.000869 |
| Level | Minor | Major | Major | - | Major | Minor | Minor |
Pivot points can also be used to set your price objectives. Here is the price situation in relation to pivot points:
| Pivot points | S3 | S2 | S1 | PP | R1 | R2 | R3 |
|---|---|---|---|---|---|---|---|
| Standard | 0.999005 | 0.999300 | 0.999560 | 0.999855 | 1.000115 | 1.000410 | 1.000670 |
| Camarilla | 0.999667 | 0.999718 | 0.999769 | 0.999820 | 0.999871 | 0.999922 | 0.999973 |
| Woodie | 0.998988 | 0.999291 | 0.999543 | 0.999846 | 1.000098 | 1.000401 | 1.000653 |
| Fibonacci | 0.999300 | 0.999512 | 0.999643 | 0.999855 | 1.000067 | 1.000198 | 1.000410 |
| Pivot points | S3 | S2 | S1 | PP | R1 | R2 | R3 |
|---|---|---|---|---|---|---|---|
| Standard | 0.997247 | 0.998178 | 0.998869 | 0.999800 | 1.000491 | 1.001422 | 1.002113 |
| Camarilla | 0.999114 | 0.999263 | 0.999411 | 0.999560 | 0.999709 | 0.999857 | 1.000006 |
| Woodie | 0.997127 | 0.998118 | 0.998749 | 0.999740 | 1.000371 | 1.001362 | 1.001993 |
| Fibonacci | 0.998178 | 0.998798 | 0.999180 | 0.999800 | 1.000420 | 1.000802 | 1.001422 |
| Pivot points | S3 | S2 | S1 | PP | R1 | R2 | R3 |
|---|---|---|---|---|---|---|---|
| Standard | 0.995862 | 0.997076 | 0.998701 | 0.999915 | 1.001540 | 1.002754 | 1.004379 |
| Camarilla | 0.999544 | 0.999805 | 1.000065 | 1.000325 | 1.000585 | 1.000846 | 1.001106 |
| Woodie | 0.996067 | 0.997179 | 0.998906 | 1.000018 | 1.001745 | 1.002857 | 1.004584 |
| Fibonacci | 0.997076 | 0.998161 | 0.998831 | 0.999915 | 1.001000 | 1.001670 | 1.002754 |
Numerical data
The following are the details of the technical indicators and moving averages that were collected to generate this technical analysis:
| RSI (14): | 44.11 | |
| MACD (12,26,9): | 0.0000 | |
| Directional Movement: | -11.109834 | |
| AROON (14): | -42.857143 | |
| DEMA (21): | 0.999832 | |
| Parabolic SAR (0,02-0,02-0,2): | 1.000001 | |
| Elder Ray (13): | -0.000100 | |
| Super Trend (3,10): | 1.000096 | |
| Zig ZAG (10): | 0.999757 | |
| VORTEX (21): | 0.9959 | |
| Stochastique (14,3,5): | 42.35 | |
| TEMA (21): | 0.999823 | |
| Williams %R (14): | -48.26 | |
| Chande Momentum Oscillator (20): | 0.000055 | |
| Repulse (5,40,3): | 0.0138 | |
| ROCnROLL: | 2 | |
| TRIX (15,9): | 0.0000 | |
| Courbe Coppock: | 0.01 |
| MA7: | 0.999772 | |
| MA20: | 1.000193 | |
| MA50: | 1.000113 | |
| MA100: | 1.000165 | |
| MAexp7: | 0.999838 | |
| MAexp20: | 0.999844 | |
| MAexp50: | 0.999841 | |
| MAexp100: | 0.999837 | |
| Price / MA7: | +0.00% | |
| Price / MA20: | -0.04% | |
| Price / MA50: | -0.03% | |
| Price / MA100: | -0.04% | |
| Price / MAexp7: | -0.01% | |
| Price / MAexp20: | -0.01% | |
| Price / MAexp50: | -0.01% | |
| Price / MAexp100: | -0.01% |
About author
Online


Add a comment
Comments
0 comments on the analysis TETHER - USDT/USD - 1H