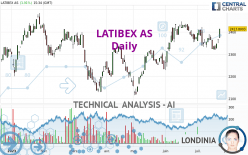
LATIBEX AS - Daily - Technical analysis published on 07/24/2023 (GMT)
- 147
- 0
Click here for a new analysis!
- Timeframe : Daily
- - Analysis generated on
- Status : INVALID

Summary of the analysis

Additional analysis
Quotes
The LATIBEX AS price is 2,413.8000 EUR. On the day, this instrument gained +1.91% and was traded between 2,374.0000 EUR and 2,413.8000 EUR over the period. The price is currently at +1.68% from its lowest and 0% from its highest.A bullish gap was detected at the opening by the Central Gaps scanner. There are a lot of buyers and they have the upper hand in the very short term.
Opening Gap UP
Type : Bullish
Timeframe : Openning
A study of price movements over other periods shows the following variations:
Near a new HIGH record (1st january)
Type : Bullish
Timeframe : Weekly
Near a new LOW record (1 month)
Type : Bearish
Timeframe : Weekly
Technical
Technical analysis of LATIBEX AS in Daily shows a strongly overall bullish trend. 92.86% of the signals given by moving averages are bullish. This strongly bullish trend is supported by the strong bullish signals given by short-term moving averages. The Central Indicators scanner detects a bullish signal on moving averages that could impact this trend:
Bullish trend reversal : adaptative moving average 20
Type : Bullish
Timeframe : Daily
Technical indicators are strongly bullish, suggesting that the price increase should continue.
Caution: the Central Indicators scanner currently detects an excess:
CCI indicator is overbought : over 100
Type : Neutral
Timeframe : Daily
Williams %R indicator is overbought : over -20
Type : Neutral
Timeframe : Daily
Pivot points : price is over resistance 2
Type : Neutral
Timeframe : Weekly
Pivot points : price is over resistance 3
Type : Neutral
Timeframe : Daily
MACD crosses UP its Moving Average
Type : Bullish
Timeframe : Daily
Parabolic SAR indicator bullish reversal
Type : Bullish
Timeframe : Daily
SuperTrend indicator bullish reversal
Type : Bullish
Timeframe : Daily
MACD indicator is back over 0
Type : Bullish
Timeframe : Daily
Momentum indicator is back over 0
Type : Bullish
Timeframe : Daily
Central Patterns, the scanner specializing in chart patterns, did not identify any signals.
For a small rebound in the very short term, the Central Candlesticks scanner currently notes the presence of this bullish pattern in Japanese candlesticks:
Upside gap
Type : Bullish
Timeframe : Daily
| S3 | S2 | S1 | Price | R1 | R2 | R3 | |
|---|---|---|---|---|---|---|---|
| ProTrendLines | 2,165.0100 | 2,232.1000 | 2,335.6200 | 2,413.8000 | 2,420.6100 | 2,467.7000 | 2,620.6200 |
| Change (%) | -10.31% | -7.53% | -3.24% | - | +0.28% | +2.23% | +8.57% |
| Change | -248.7900 | -181.7000 | -78.1800 | - | +6.8100 | +53.9000 | +206.8200 |
| Level | Major | Minor | Major | - | Intermediate | Major | Major |
To determine price objectives, it is also possible to use the pivot points. Here is the price position in relation to pivot points:
| Pivot points | S3 | S2 | S1 | PP | R1 | R2 | R3 |
|---|---|---|---|---|---|---|---|
| Standard | 2,347.4667 | 2,360.7333 | 2,387.2667 | 2,400.5333 | 2,427.0667 | 2,440.3333 | 2,466.8667 |
| Camarilla | 2,402.8550 | 2,406.5033 | 2,410.1517 | 2,413.8000 | 2,417.4483 | 2,421.0967 | 2,424.7450 |
| Woodie | 2,354.1000 | 2,364.0500 | 2,393.9000 | 2,403.8500 | 2,433.7000 | 2,443.6500 | 2,473.5000 |
| Fibonacci | 2,360.7333 | 2,375.9369 | 2,385.3297 | 2,400.5333 | 2,415.7369 | 2,425.1297 | 2,440.3333 |
| Pivot points | S3 | S2 | S1 | PP | R1 | R2 | R3 |
|---|---|---|---|---|---|---|---|
| Standard | 2,289.3333 | 2,305.1667 | 2,336.8333 | 2,352.6667 | 2,384.3333 | 2,400.1667 | 2,431.8333 |
| Camarilla | 2,355.4375 | 2,359.7917 | 2,364.1458 | 2,368.5000 | 2,372.8542 | 2,377.2083 | 2,381.5625 |
| Woodie | 2,297.2500 | 2,309.1250 | 2,344.7500 | 2,356.6250 | 2,392.2500 | 2,404.1250 | 2,439.7500 |
| Fibonacci | 2,305.1667 | 2,323.3117 | 2,334.5217 | 2,352.6667 | 2,370.8117 | 2,382.0217 | 2,400.1667 |
| Pivot points | S3 | S2 | S1 | PP | R1 | R2 | R3 |
|---|---|---|---|---|---|---|---|
| Standard | 2,032.9000 | 2,130.2000 | 2,253.6000 | 2,350.9000 | 2,474.3000 | 2,571.6000 | 2,695.0000 |
| Camarilla | 2,316.3075 | 2,336.5383 | 2,356.7692 | 2,377.0000 | 2,397.2308 | 2,417.4617 | 2,437.6925 |
| Woodie | 2,045.9500 | 2,136.7250 | 2,266.6500 | 2,357.4250 | 2,487.3500 | 2,578.1250 | 2,708.0500 |
| Fibonacci | 2,130.2000 | 2,214.5074 | 2,266.5926 | 2,350.9000 | 2,435.2074 | 2,487.2926 | 2,571.6000 |
Numerical data
The following is the status of the technical indicators and moving averages at the time of publication of this technical analysis:
| RSI (14): | 60.38 | |
| MACD (12,26,9): | 0.9284 | |
| Directional Movement: | 12.7004 | |
| AROON (14): | -64.2857 | |
| DEMA (21): | 2,366.8770 | |
| Parabolic SAR (0,02-0,02-0,2): | 2,321.0000 | |
| Elder Ray (13): | 30.4636 | |
| Super Trend (3,10): | 2,309.3883 | |
| Zig ZAG (10): | 2,413.8000 | |
| VORTEX (21): | 0.9246 | |
| Stochastique (14,3,5): | 54.95 | |
| TEMA (21): | 2,354.7720 | |
| Williams %R (14): | -7.85 | |
| Chande Momentum Oscillator (20): | 75.0000 | |
| Repulse (5,40,3): | 2.5656 | |
| ROCnROLL: | 1 | |
| TRIX (15,9): | -0.0020 | |
| Courbe Coppock: | 1.76 |
| MA7: | 2,353.0714 | |
| MA20: | 2,364.5000 | |
| MA50: | 2,352.5620 | |
| MA100: | 2,297.3610 | |
| MAexp7: | 2,365.9069 | |
| MAexp20: | 2,363.9807 | |
| MAexp50: | 2,347.6068 | |
| MAexp100: | 2,332.9163 | |
| Price / MA7: | +2.58% | |
| Price / MA20: | +2.09% | |
| Price / MA50: | +2.60% | |
| Price / MA100: | +5.07% | |
| Price / MAexp7: | +2.02% | |
| Price / MAexp20: | +2.11% | |
| Price / MAexp50: | +2.82% | |
| Price / MAexp100: | +3.47% |
About author
Online


Add a comment
Comments
0 comments on the analysis LATIBEX AS - Daily