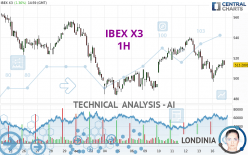
IBEX X3 - 1H - Technical analysis published on 10/16/2023 (GMT)
- 112
- 0
- Timeframe : 1H
- - Analysis generated on
- Status : NEUTRAL

Summary of the analysis

Additional analysis
Quotes
IBEX X3 rating 517.5000 EUR. The price registered an increase of +2.21% on the session with the lowest point at 496.3000 EUR and the highest point at 518.0000 EUR. The deviation from the price is +4.27% for the low point and -0.10% for the high point.A bullish opening was detected by the Central Gaps scanner. Buyers are trying to impose a bullish momentum in the very short term.
Bullish opening
Type : Bullish
Timeframe : Openning
Here is a more detailed summary of the historical variations registered by IBEX X3:
Near a new LOW record (1 month)
Type : Bearish
Timeframe : Weekly
Technical
Technical analysis of IBEX X3 in 1H shows a neutral overall trend. The slightly bullish signals currently given by short-term moving averages could allow the overall trend to return to a slightly bullish trend. The Central Indicators market scanner is currently detecting several bullish signals that could impact this trend:
Bullish price crossover with Moving Average 20
Type : Bullish
Timeframe : 1 hour
Bullish price crossover with Moving Average 100
Type : Bullish
Timeframe : 1 hour
Bullish price crossover with adaptative moving average 50
Type : Bullish
Timeframe : 1 hour
Bullish price crossover with adaptative moving average 100
Type : Bullish
Timeframe : 1 hour
An assessment of technical indicators shows a moderate bullish signal.
Caution: the Central Indicators scanner currently detects an excess:
Williams %R indicator is overbought : over -20
Type : Neutral
Timeframe : 1 hour
RSI indicator is back over 50
Type : Bullish
Timeframe : 1 hour
MACD crosses UP its Moving Average
Type : Bullish
Timeframe : 1 hour
Ichimoku : price is over the cloud
Type : Bullish
Timeframe : 1 hour
Price is back over the pivot point
Type : Bullish
Timeframe : 1 hour
Price is back over the pivot point
Type : Bullish
Timeframe : Weekly
Momentum indicator is back over 0
Type : Bullish
Timeframe : 1 hour
The analysis of the price chart with Central Patterns scanners does not return any result.
The Central Candlesticks scanner, specialised in Japanese candlesticks, did not identify any signals.
| S3 | S2 | S1 | Price | R1 | R2 | R3 | |
|---|---|---|---|---|---|---|---|
| ProTrendLines | 456.7800 | 487.4000 | 500.0000 | 517.5000 | 526.7333 | 545.0000 | 556.8300 |
| Change (%) | -11.73% | -5.82% | -3.38% | - | +1.78% | +5.31% | +7.60% |
| Change | -60.7200 | -30.1000 | -17.5000 | - | +9.2333 | +27.5000 | +39.3300 |
| Level | Major | Major | Major | - | Major | Intermediate | Intermediate |
Attention could also be paid to pivot points to set price objectives:
| Pivot points | S3 | S2 | S1 | PP | R1 | R2 | R3 |
|---|---|---|---|---|---|---|---|
| Standard | 474.4667 | 489.6333 | 497.9667 | 513.1333 | 521.4667 | 536.6333 | 544.9667 |
| Camarilla | 499.8375 | 501.9917 | 504.1458 | 506.3000 | 508.4542 | 510.6083 | 512.7625 |
| Woodie | 471.0500 | 487.9250 | 494.5500 | 511.4250 | 518.0500 | 534.9250 | 541.5500 |
| Fibonacci | 489.6333 | 498.6103 | 504.1563 | 513.1333 | 522.1103 | 527.6563 | 536.6333 |
| Pivot points | S3 | S2 | S1 | PP | R1 | R2 | R3 |
|---|---|---|---|---|---|---|---|
| Standard | 430.0333 | 458.9667 | 482.6333 | 511.5667 | 535.2333 | 564.1667 | 587.8333 |
| Camarilla | 491.8350 | 496.6567 | 501.4783 | 506.3000 | 511.1217 | 515.9433 | 520.7650 |
| Woodie | 427.4000 | 457.6500 | 480.0000 | 510.2500 | 532.6000 | 562.8500 | 585.2000 |
| Fibonacci | 458.9667 | 479.0599 | 491.4735 | 511.5667 | 531.6599 | 544.0735 | 564.1667 |
| Pivot points | S3 | S2 | S1 | PP | R1 | R2 | R3 |
|---|---|---|---|---|---|---|---|
| Standard | 435.2667 | 474.8333 | 508.8667 | 548.4333 | 582.4667 | 622.0333 | 656.0667 |
| Camarilla | 522.6600 | 529.4067 | 536.1533 | 542.9000 | 549.6467 | 556.3933 | 563.1400 |
| Woodie | 432.5000 | 473.4500 | 506.1000 | 547.0500 | 579.7000 | 620.6500 | 653.3000 |
| Fibonacci | 474.8333 | 502.9485 | 520.3181 | 548.4333 | 576.5485 | 593.9181 | 622.0333 |
Numerical data
The following is the status of the technical indicators and moving averages at the time of publication of this technical analysis:
| RSI (14): | 52.44 | |
| MACD (12,26,9): | -2.5687 | |
| Directional Movement: | -3.4111 | |
| AROON (14): | -57.1429 | |
| DEMA (21): | 511.2093 | |
| Parabolic SAR (0,02-0,02-0,2): | 499.0294 | |
| Elder Ray (13): | 0.8009 | |
| Super Trend (3,10): | 521.9537 | |
| Zig ZAG (10): | 517.5000 | |
| VORTEX (21): | 0.8086 | |
| Stochastique (14,3,5): | 69.66 | |
| TEMA (21): | 508.3693 | |
| Williams %R (14): | -4.05 | |
| Chande Momentum Oscillator (20): | 5.2000 | |
| Repulse (5,40,3): | 2.0660 | |
| ROCnROLL: | 1 | |
| TRIX (15,9): | -0.0905 | |
| Courbe Coppock: | 3.47 |
| MA7: | 515.0857 | |
| MA20: | 528.0000 | |
| MA50: | 537.8080 | |
| MA100: | 547.4300 | |
| MAexp7: | 512.5442 | |
| MAexp20: | 514.4302 | |
| MAexp50: | 516.1585 | |
| MAexp100: | 518.7359 | |
| Price / MA7: | +0.47% | |
| Price / MA20: | -1.99% | |
| Price / MA50: | -3.78% | |
| Price / MA100: | -5.47% | |
| Price / MAexp7: | +0.97% | |
| Price / MAexp20: | +0.60% | |
| Price / MAexp50: | +0.26% | |
| Price / MAexp100: | -0.24% |
About author
Online


Add a comment
Comments
0 comments on the analysis IBEX X3 - 1H