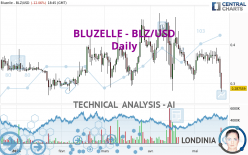
BLUZELLE - BLZ/USD - Daily - Technical analysis published on 05/19/2024 (GMT)
- 86
- 0
Click here for a new analysis!
- Timeframe : Daily
- - Analysis generated on
- Status : TARGET REACHED

Summary of the analysis

Additional analysis
Quotes
The BLUZELLE - BLZ/USD rating is 0.287559 USD. The price registered a decrease of -12.06% on the session and was between 0.278277 USD and 0.327019 USD. This implies that the price is at +3.34% from its lowest and at -12.07% from its highest.The Central Gaps scanner detects a bearish opening marking the presence of sellers ahead of buyers at the opening but not sufficiently marked to allow the price to register a quotation gap.
Bearish opening
Type : Bearish
Timeframe : Openning
A study of price movements over other periods shows the following variations:
Near a new LOW record (1st january)
Type : Bearish
Timeframe : Weekly
New LOW record (1 month)
Type : Bearish
Timeframe : Weekly
Technical
Technical analysis of this Daily chart of BLUZELLE - BLZ/USD indicates that the overall trend is strongly bearish. The signals given by moving averages are 85.71% bearish. This strong bearish trend is confirmed by the strong signals currently being given by short-term moving averages. The Central Indicators scanner detects bullish and bearish signals on moving averages that could impact this trend:
Bearish trend reversal : Moving Average 20
Type : Bearish
Timeframe : Daily
Bearish trend reversal : adaptative moving average 20
Type : Bearish
Timeframe : Daily
Moving Average bearish crossovers : AMA50 & AMA100
Type : Bearish
Timeframe : Daily
Bullish price crossover with Moving Average 20
Type : Bullish
Timeframe : Daily
Bullish price crossover with adaptative moving average 50
Type : Bullish
Timeframe : Daily
Bullish price crossover with adaptative moving average 100
Type : Bullish
Timeframe : Daily
An assessment of technical indicators does not currently provide any relevant information on the direction of future price movements.
Caution: the Central Indicators scanner currently detects an excess:
RSI indicator is oversold : under 30
Type : Neutral
Timeframe : Daily
CCI indicator is oversold : under -100
Type : Neutral
Timeframe : Daily
Williams %R indicator is oversold : under -80
Type : Neutral
Timeframe : Daily
Pivot points : price is under support 1
Type : Neutral
Timeframe : Weekly
Pivot points : price is under support 3
Type : Neutral
Timeframe : Daily
Central Patterns, the market scanner focusing on chart patterns, resistances and supports found this result:
Horizontal resistance is broken
Type : Bullish
Timeframe : Daily
The Central Candlesticks scanner which studies Japanese candlesticks did not detect anything.
| S3 | S2 | S1 | Price | R1 | R2 | R3 | |
|---|---|---|---|---|---|---|---|
| ProTrendLines | 0.214767 | 0.232651 | 0.259002 | 0.287559 | 0.290673 | 0.307819 | 0.361002 |
| Change (%) | -25.31% | -19.09% | -9.93% | - | +1.08% | +7.05% | +25.54% |
| Change | -0.072792 | -0.054908 | -0.028557 | - | +0.003114 | +0.020260 | +0.073443 |
| Level | Minor | Minor | Minor | - | Major | Minor | Major |
Pivot points can also be used to set your price objectives. Here is the price situation in relation to pivot points:
| Pivot points | S3 | S2 | S1 | PP | R1 | R2 | R3 |
|---|---|---|---|---|---|---|---|
| Standard | 0.253826 | 0.285489 | 0.306248 | 0.337911 | 0.358670 | 0.390333 | 0.411092 |
| Camarilla | 0.312591 | 0.317396 | 0.322202 | 0.327007 | 0.331812 | 0.336618 | 0.341423 |
| Woodie | 0.248374 | 0.282763 | 0.300796 | 0.335185 | 0.353218 | 0.387607 | 0.405640 |
| Fibonacci | 0.285489 | 0.305514 | 0.317886 | 0.337911 | 0.357936 | 0.370308 | 0.390333 |
| Pivot points | S3 | S2 | S1 | PP | R1 | R2 | R3 |
|---|---|---|---|---|---|---|---|
| Standard | 0.224351 | 0.270752 | 0.298879 | 0.345280 | 0.373407 | 0.419808 | 0.447935 |
| Camarilla | 0.306512 | 0.313344 | 0.320175 | 0.327007 | 0.333839 | 0.340671 | 0.347502 |
| Woodie | 0.215215 | 0.266184 | 0.289743 | 0.340712 | 0.364271 | 0.415240 | 0.438799 |
| Fibonacci | 0.270752 | 0.299221 | 0.316810 | 0.345280 | 0.373749 | 0.391338 | 0.419808 |
| Pivot points | S3 | S2 | S1 | PP | R1 | R2 | R3 |
|---|---|---|---|---|---|---|---|
| Standard | 0.041247 | 0.160990 | 0.242138 | 0.361881 | 0.443029 | 0.562772 | 0.643920 |
| Camarilla | 0.268040 | 0.286455 | 0.304870 | 0.323285 | 0.341700 | 0.360115 | 0.378530 |
| Woodie | 0.021949 | 0.151341 | 0.222840 | 0.352232 | 0.423731 | 0.553123 | 0.624622 |
| Fibonacci | 0.160990 | 0.237731 | 0.285141 | 0.361881 | 0.438622 | 0.486032 | 0.562772 |
Numerical data
The following is the status of the technical indicators and moving averages at the time of publication of this technical analysis:
| RSI (14): | 27.90 | |
| MACD (12,26,9): | -0.0109 | |
| Directional Movement: | -22.227478 | |
| AROON (14): | -21.428571 | |
| DEMA (21): | 0.343260 | |
| Parabolic SAR (0,02-0,02-0,2): | 0.419400 | |
| Elder Ray (13): | -0.046826 | |
| Super Trend (3,10): | 0.390205 | |
| Zig ZAG (10): | 0.281460 | |
| VORTEX (21): | 0.8961 | |
| Stochastique (14,3,5): | 15.77 | |
| TEMA (21): | 0.336683 | |
| Williams %R (14): | -97.76 | |
| Chande Momentum Oscillator (20): | -0.082636 | |
| Repulse (5,40,3): | -32.2503 | |
| ROCnROLL: | 2 | |
| TRIX (15,9): | -0.1879 | |
| Courbe Coppock: | 8.30 |
| MA7: | 0.349406 | |
| MA20: | 0.358094 | |
| MA50: | 0.376881 | |
| MA100: | 0.368572 | |
| MAexp7: | 0.337618 | |
| MAexp20: | 0.355572 | |
| MAexp50: | 0.365201 | |
| MAexp100: | 0.357825 | |
| Price / MA7: | -17.70% | |
| Price / MA20: | -19.70% | |
| Price / MA50: | -23.70% | |
| Price / MA100: | -21.98% | |
| Price / MAexp7: | -14.83% | |
| Price / MAexp20: | -19.13% | |
| Price / MAexp50: | -21.26% | |
| Price / MAexp100: | -19.64% |
About author

Online


Add a comment
Comments
0 comments on the analysis BLUZELLE - BLZ/USD - Daily