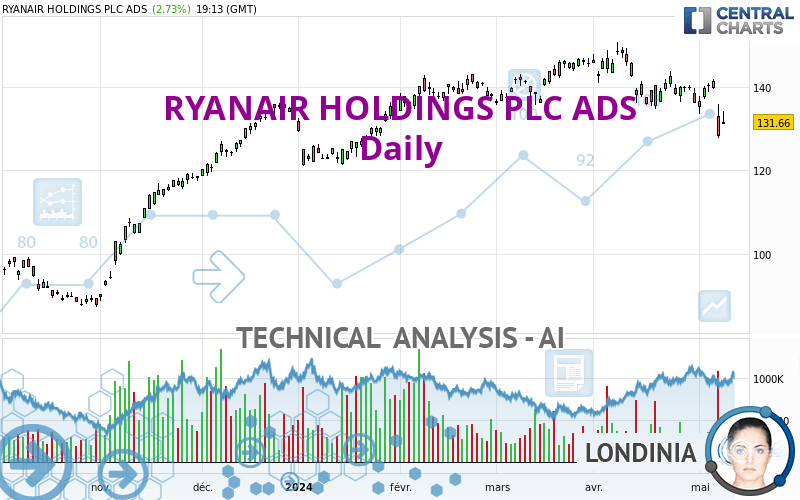
RYANAIR HOLDINGS PLC ADS - Daily - Technical analysis published on 05/08/2024 (GMT)
- 84
- 0
Click here for a new analysis!
- Timeframe : Daily
- - Analysis generated on
- Status : TARGET REACHED

Summary of the analysis

Additional analysis
Quotes
The RYANAIR HOLDINGS PLC ADS price is 131.66 USD. The price registered an increase of +2.73% on the session with the lowest point at 131.18 USD and the highest point at 134.12 USD. The deviation from the price is +0.37% for the low point and -1.83% for the high point.The Central Gaps scanner detects a bullish opening. A small advantage for buyers in the very short term.
Bullish opening
Type : Bullish
Timeframe : Openning
A study of price movements over other periods shows the following variations:
Near a new LOW record (1 month)
Type : Bearish
Timeframe : Weekly
Technical
A technical analysis in Daily of this RYANAIR HOLDINGS PLC ADS chart shows a bearish trend. 67.86% of the signals given by moving averages are bearish. This bearish trend is supported by the strong bearish signals given by short-term moving averages. An assessment of moving averages reveals several bearish signals that could impact this trend:
Bearish trend reversal : adaptative moving average 20
Type : Bearish
Timeframe : Daily
Bearish trend reversal : adaptative moving average 50
Type : Bearish
Timeframe : Daily
Bearish trend reversal : adaptative moving average 100
Type : Bearish
Timeframe : Daily
The technical indicators are generally neutral. They do not provide relevant information on the direction of future price movements.
Caution: the Central Indicators scanner currently detects an excess:
CCI indicator is oversold : under -100
Type : Neutral
Timeframe : Daily
Previous candle closed under Bollinger bands
Type : Neutral
Timeframe : Daily
CCI indicator: bullish divergence
Type : Bullish
Timeframe : Daily
RSI indicator: bullish divergence
Type : Bullish
Timeframe : Daily
Pivot points : price is under support 1
Type : Neutral
Timeframe : Weekly
Central Patterns, the market scanner focusing on chart patterns, resistances and supports found this result:
Support of channel is broken
Type : Bearish
Timeframe : Daily
Central Candlesticks, the scanner specialised in Japanese candlesticks, detects a bullish signal that could support the hypothesis of a small rebound in the very short term:
Bullish harami
Type : Bullish
Timeframe : Daily
| S3 | S2 | S1 | Price | R1 | R2 | R3 | |
|---|---|---|---|---|---|---|---|
| ProTrendLines | 110.55 | 120.21 | 125.42 | 131.66 | 135.78 | 142.58 | 148.58 |
| Change (%) | -16.03% | -8.70% | -4.74% | - | +3.13% | +8.29% | +12.85% |
| Change | -21.11 | -11.45 | -6.24 | - | +4.12 | +10.92 | +16.92 |
| Level | Intermediate | Minor | Major | - | Major | Intermediate | Minor |
Attention could also be paid to pivot points to set price objectives:
| Pivot points | S3 | S2 | S1 | PP | R1 | R2 | R3 |
|---|---|---|---|---|---|---|---|
| Standard | 117.15 | 122.45 | 125.30 | 130.60 | 133.45 | 138.75 | 141.60 |
| Camarilla | 125.92 | 126.67 | 127.41 | 128.16 | 128.91 | 129.65 | 130.40 |
| Woodie | 115.94 | 121.84 | 124.09 | 129.99 | 132.24 | 138.14 | 140.39 |
| Fibonacci | 122.45 | 125.56 | 127.48 | 130.60 | 133.71 | 135.63 | 138.75 |
| Pivot points | S3 | S2 | S1 | PP | R1 | R2 | R3 |
|---|---|---|---|---|---|---|---|
| Standard | 128.01 | 130.75 | 135.52 | 138.26 | 143.03 | 145.77 | 150.54 |
| Camarilla | 138.24 | 138.92 | 139.61 | 140.30 | 140.99 | 141.68 | 142.37 |
| Woodie | 129.04 | 131.26 | 136.55 | 138.77 | 144.06 | 146.28 | 151.57 |
| Fibonacci | 130.75 | 133.62 | 135.39 | 138.26 | 141.13 | 142.90 | 145.77 |
| Pivot points | S3 | S2 | S1 | PP | R1 | R2 | R3 |
|---|---|---|---|---|---|---|---|
| Standard | 114.43 | 124.59 | 130.40 | 140.56 | 146.37 | 156.53 | 162.34 |
| Camarilla | 131.81 | 133.27 | 134.74 | 136.20 | 137.66 | 139.13 | 140.59 |
| Woodie | 112.25 | 123.50 | 128.22 | 139.47 | 144.19 | 155.44 | 160.16 |
| Fibonacci | 124.59 | 130.69 | 134.46 | 140.56 | 146.66 | 150.43 | 156.53 |
Numerical data
The following is the status of technical indicators and moving averages registered at the time this technical analysis was created:
| RSI (14): | 39.32 | |
| MACD (12,26,9): | -1.9400 | |
| Directional Movement: | -19.97 | |
| AROON (14): | -71.43 | |
| DEMA (21): | 136.13 | |
| Parabolic SAR (0,02-0,02-0,2): | 141.91 | |
| Elder Ray (13): | -4.53 | |
| Super Trend (3,10): | 144.90 | |
| Zig ZAG (10): | 131.77 | |
| VORTEX (21): | 0.7600 | |
| Stochastique (14,3,5): | 35.13 | |
| TEMA (21): | 134.28 | |
| Williams %R (14): | -74.33 | |
| Chande Momentum Oscillator (20): | -8.94 | |
| Repulse (5,40,3): | -3.4900 | |
| ROCnROLL: | 2 | |
| TRIX (15,9): | -0.1300 | |
| Courbe Coppock: | 4.34 |
| MA7: | 136.32 | |
| MA20: | 138.25 | |
| MA50: | 141.00 | |
| MA100: | 136.64 | |
| MAexp7: | 135.55 | |
| MAexp20: | 138.32 | |
| MAexp50: | 138.90 | |
| MAexp100: | 134.21 | |
| Price / MA7: | -3.42% | |
| Price / MA20: | -4.77% | |
| Price / MA50: | -6.62% | |
| Price / MA100: | -3.64% | |
| Price / MAexp7: | -2.87% | |
| Price / MAexp20: | -4.81% | |
| Price / MAexp50: | -5.21% | |
| Price / MAexp100: | -1.90% |
News
Don't forget to follow the news on RYANAIR HOLDINGS PLC ADS. At the time of publication of this analysis, the latest news was as follows:
-
 Ryanair: 'very real chance' UK flights could be paused
-
Ryanair CEO: There's Another Risk Of Laptop Ban On Airlines | Squawk Box | CNBC
-
Ryanair
-
Ryanair CFO Neil Sorahan on 'abuse' of two bag system
-
Ryanair's CFO: See More Growth Going Into Mainland Europe
About author
Online


Add a comment
Comments
0 comments on the analysis RYANAIR HOLDINGS PLC ADS - Daily